Jessie Moore has been writing professionally for nearly two decades; for the past seven years, she's focused on writing, ghostwriting, and editing in the finance space. She is a Today Show and Publisher's Weekly-featured author who has written or ghostwritten 10+ books on a wide variety of topics, ranging from day trading to unicorns to plant care.
If you want to invest in stocks, it’s crucial to learn how to read a stock quote.
A stock quote can provide a treasure trove of insight about a stock — if you know what to look for.
The better grasp you have on the information contained in the stock quote, the more informed decisions you can make about potential investments.
Ready to learn how to read a stock table? In this article, we’ll cover everything you need to know, starting with basics like what are stock quotes, then progressing on to the art of reading a stock quote, with several stock quote examples to illustrate the ideas discussed.
To put your stock quote knowledge to work as an investor, you need a broker.
One of our top picks? eToro.
On eToro, you can both trade and discuss your strategies with traders and investors the whole world round. Its CopyTrader feature lets you follow (and copy, if you like) the trades of professional traders. All you have to do is select your favorite trader(s) and let the app do the rest.
See for yourself why 30 million users have trusted eToro and why it has earned a “Great” rating on TrustPilot. Use the link below and get a $10 bonus when you deposit $100 or more. (Terms and conditions apply.)
eToro is a multi-asset platform which offers both investing in stocks and cryptoassets, as well as trading CFDs. Please note that CFDs are complex instruments and come with a high risk of losing money rapidly due to leverage. 61% of retail investor accounts lose money when trading CFDs with this provider. You should consider whether you understand how CFDs work, and whether you can afford to take the high risk of losing your money. This communication is intended for information and educational purposes only and should not be considered investment advice or investment recommendation. Past performance is not an indication of future results. Copy Trading does not amount to investment advice. The value of your investments may go up or down. Your capital is at risk. Crypto investments are risky and may not suit retail investors; you could lose your entire investment. Understand the risks here. Don’t invest unless you’re prepared to lose all the money you invest. This is a high-risk investment and you should not expect to be protected if something goes wrong. Take 2 mins to learn more eToro USA LLC does not offer CFDs and makes no representation and assumes no liability as to the accuracy or completeness of the content of this publication, which has been prepared by our partner utilizing publicly available non-entity specific information about eToro.
How to Read a Stock Quote: The Bottom Line
No matter what type of investor you are, stock quotes can be useful.
A stock price’s quote isn’t just about the cost per share. It’s a shortcut to all of the basic information you need to quickly identify and assess an asset.
Stock quotes are one of the most effective and fastest ways to see how the performance of an asset is changing — often in real-time. This makes it one of the easiest ways to quickly compare multiple assets.
A stock quote alone might not tell you whether or not you should buy a stock. But it can give you enough information to know if you should dig deeper. Let’s explore.
What are Stock Quotes?
Stock quotes come in all shapes and sizes. But despite the many variations out there, they all serve the same primary purpose — to give you at-a-glance information about the security in question.
But like I said, they’re not all the same. So to approach teaching you how to read a stock table, we’ll start with a few foundational basics. Then, we’ll talk about the common elements of a stock quote and how to use them.
Before You Read a Stock Quote: Basics to Know
A stock quote works hand in hand with a stock chart. In case you need a refresher, here are some of the primary types of stock charts to know about:
Types of Stock Charts
- A line chart is one of the most common types and pops up whenever you, for example, Google “Intriguing company stock price”. This type is great for getting the general gist of an asset but doesn’t offer a lot of insight into exact trends and patterns.
- The bar chart offers some additional insight into the high, low, open, and close of any selected timeframe.
- Candlestick charts are similar to bar tables and are very popular with experienced traders as they offer even greater insight into the asset you are interested in. They are also very readable thanks to the way they are color-coded with green/white indicating that the closing price is higher than the opening one, and a red/black “candle” showing that the price at the close was lower than at the opening. A horizontal line indicates no change.
Worth noting: You’ll generally be able to adjust the time frame covered by a stock table depending on your investing or trading needs.
Considering that the combo of quote and chart offers key information about an asset’s performance and both past and likely future outcomes, you probably want the best charting platform possible.
I personally always use TradingView due to its readability, customizability, broker integration, and general utility.
Learning about stock charts and learning how to read a stock table isn’t much good if you don’t understand basic stock patterns.
Explore common stock patterns in our comprehensive article — 14 Stock Chart Patterns: How to Read Trading Chart Patterns.
How to Read a Stock Table
While stock quotes come in all sorts of styles, here are some of the key elements you’ll likely find on them:
Common Stock Quote Information
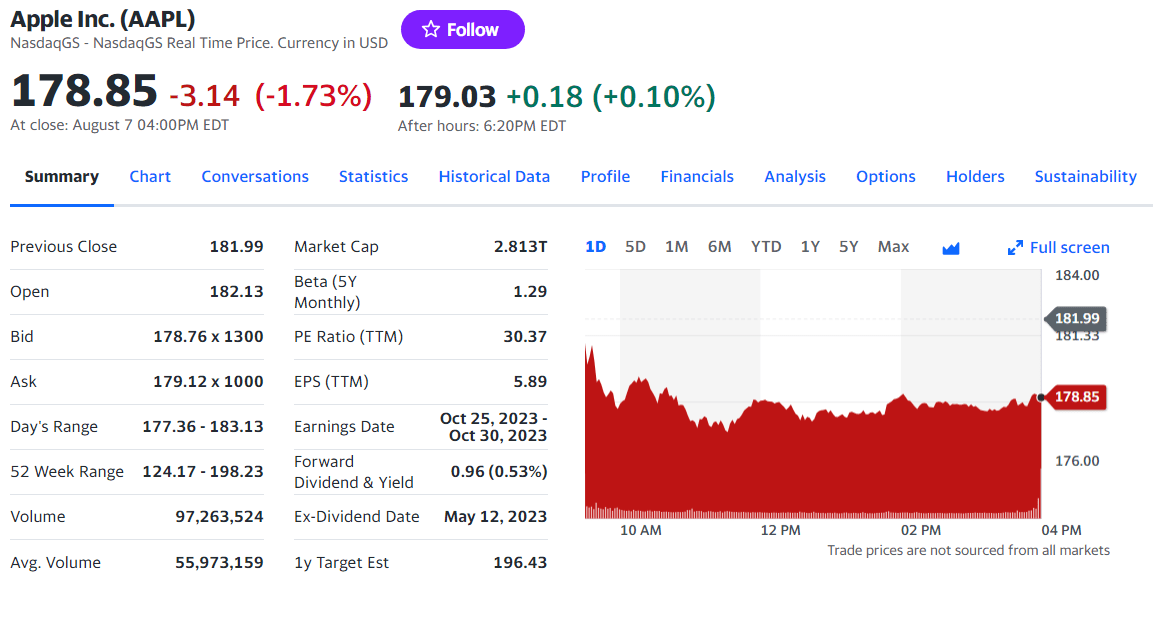
Company Name
You’ll generally find the name of the company you are interested in at the very top of any quote. After all, none of the information is very useful unless you know what it relates to, right?
Stock Ticker and Exchange
The ticker and exchange are crucial pieces of info on a stock quote. They’re typically shown together, with the exchange followed by the stock’s ticker symbol, ex: NYSE: HD
In this case, NYSE stands for New York Stock Exchange (the exchange on which the stock trades) and HD stands for the company behind the stock — Home Depot.
Bid/Ask
Another bit of information you’ll almost universally find on a quote is the bid/ask. The bid represents the highest price a buyer is willing to pay for a certain number of shares at a given time.
In turn, ask is the lowest price at which the seller is willing to part with the shares.
Average volume
Most stock quotes display the average trading volume, or how many shares are traded in a given period. Often, it covers a period of 3 or 6 months or a year.
This metric helps you gauge how much interest is in any particular stock over an extended period of time.
Want to know more?
Check out our article on the 4 best volume indicators for traders.
Previous close
The previous close tells you what price a stock was trading at the end of the previous market day.
Today’s open
While today’s open shows you what was that stock’s value at the current day’s opening.
Day range
A stock quote will show you the asset’s daily range — how much its price is fluctuating within any given day.
52-week high/low
Many quotes will also display the highest and lowest prices a stock reached in the previous 52 weeks. These are seen as key levels — breaking a new high or descending to a new low can be a significant moment for a stock.
% below high
This element informs you whether a stock is currently below its high for the selected timeframe and, if it is, the percentage is below said high.
Annual dividend / yield
This entry shows you what the dividend is expressed as a percentage of the current price of a stock. It helps you understand how much you’ll get every year from each share you purchase.
Want to know more about dividends? Don’t miss our article about how to build a dividend portfolio, and be sure to check out WallStreetZen’s Dividend Stock Screener.
Beta
Beta measures the stock’s sensitivity to the rest of the market. This metric actually compares a stock with a broader benchmark — often, the S&P 500. It is expressed with a number that can either be lower, equal, or higher than 1.
Beta equal to 1 means that the stock is performing almost exactly like the benchmark. The higher the number gets, the more likely the performance is to deviate from the rest of the market.
Want more beta?
On WallStreetZen, there are several ways to screen stocks by beta:
Earnings per share (EPS)
Earnings per share (EPS) is a metric that displays the sum total of earnings paid to investors per share over the course of the previous 12 months.
When it comes to the EPS, the higher the number you see the better as it is a measurement of how profitable the company has been in the given timeframe.
Earnings date
Stock quotes also often tell you when the company will publish its next earnings report. These dates are significant as the price of a stock tends to fluctuate more than usual when the company announces its quarterly results.
Be mindful that these reports are often published either after the market is closed or in premarket hours. This means you might need a broker that offers extended trading to take advantage of the immediate effects.
Making the most of earnings season…
moomoo has a great tool for traders who are interested in earnings. On their proprietary earnings hub, you can access the upcoming earnings schedule, conference call, and earnings interpretations of the companies you are following on the platform.
Not only does this save you precious research time, but it helps you focus on the companies and stocks you care about.
Dividend rate, yield, and ex-dividend date
The dividend rate and yield is a slightly different metric to the annual dividend/yield. Instead of showing the value as a percentage of the current share price, it tells you the actual amount of money a company will pay its shareholders based on their stake.
The ex-dividend date is an important element that can be found on some stock quotes. It informs you of whether you are eligible for the next dividend payment based on the timing of your purchase.
Historical volatility
Historical volatility is another metric that can be found in stock quotes. It measures the dispersion of returns for a stock and informs you of its volatility.
Volatility indicates how much a stock’s price has been fluctuating over a certain period. Higher volatility means that the stock is both risky and has the potential for great returns as its value seldom stays at the same level.
Learn more: What makes stocks go up and down?
Last time / last size
This element of a stock quote is closely linked to the bid and ask price as it shows you the actual number of shares available at said price. You’ll often find it on a quote next to bid/ask fields as a number in brackets next to the price.
Market Cap
Market capitalization, or Market cap for short, is another element commonly found in stock quotes.
It indicates the size of a company calculated by multiplying the number of its shares by their price. It can give you a quick idea of how big the company is.
Price-to-earnings ratio (P/E ratio)
The P/E ratio is a popular metric of whether a particular stock can be considered cheap or pricey. It is calculated by dividing the share price by earnings per share for the previous 12 months.
Generally, it is considered that lower ratios indicate that the stock is relatively cheap.
Learn more: What is a good P/E ratio for a stock?
Revenue
Revenue is another metric often found on stock quotes and represents the money brought by a company’s regular business operations. It is also often referred to as “sales.”
Shares outstanding
Shares outstanding is the metric used to inform you of the total number of shares that a company has issued but are not held by the issuing firm. Shares held by the firm that issued them are called treasury shares.
Other Important Information…
Apart from the company and shares-focused information, you are bound to find whenever reading a stock quote, you might also find some data telling you what other investors are doing with a particular asset.
Percentage held by institutional investors
Generally, institutional investors have professionals at the helm, vast resources, and information that can be hard to attain for retail investors.
They count pension, hedge, and mutual funds, as well as investment banks, insurance companies, and other major financial institutions among their numbers.
As a result, a popular metric used when gauging a company’s stock is finding out just how much of it is held by these major institutions. The % held by institutional investors is just the stock quote element that gives you this information.
Short interest
Short interest is a stock quote element that can help give you the vibe of whether investors in general are feeling bullish or bearish.
It measures the percentage of available shares that are being sold short and if the percentage is above 20% it is generally considered pretty high.
Essentially, short interest tells you if other investors are expecting a stock to lose value in the relatively near future. Additionally, if it is the stock of a beloved firm down on its luck, it tells you that you might want to check Reddit to see what people are saying.
Interested in short selling? Our best overall pick for a short selling broker is moomoo.
Want to know more? Check out our article on the best broker for short selling.
Stock Quote Example: 1 Stock, 3 Different Platforms
One of the major hurdles when it comes to figuring out how to read stock quotes is that they aren’t exactly standardized. So let’s take a look at a few examples so you can see how the information is expressed on different platforms.
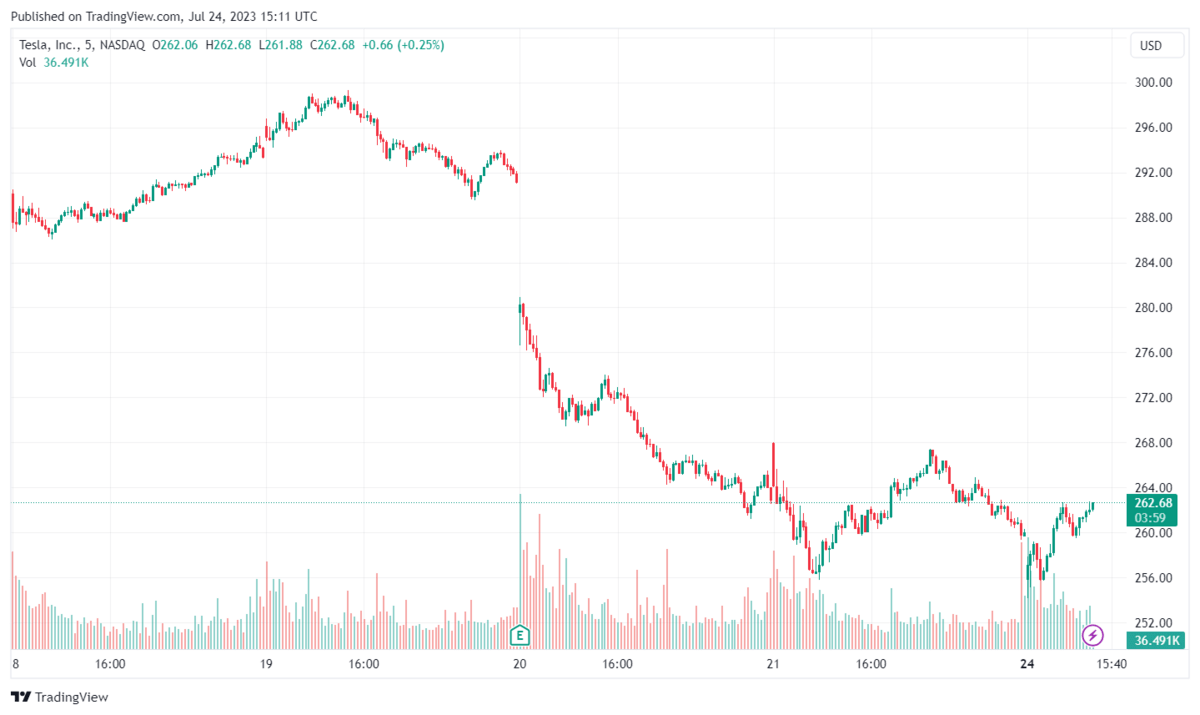
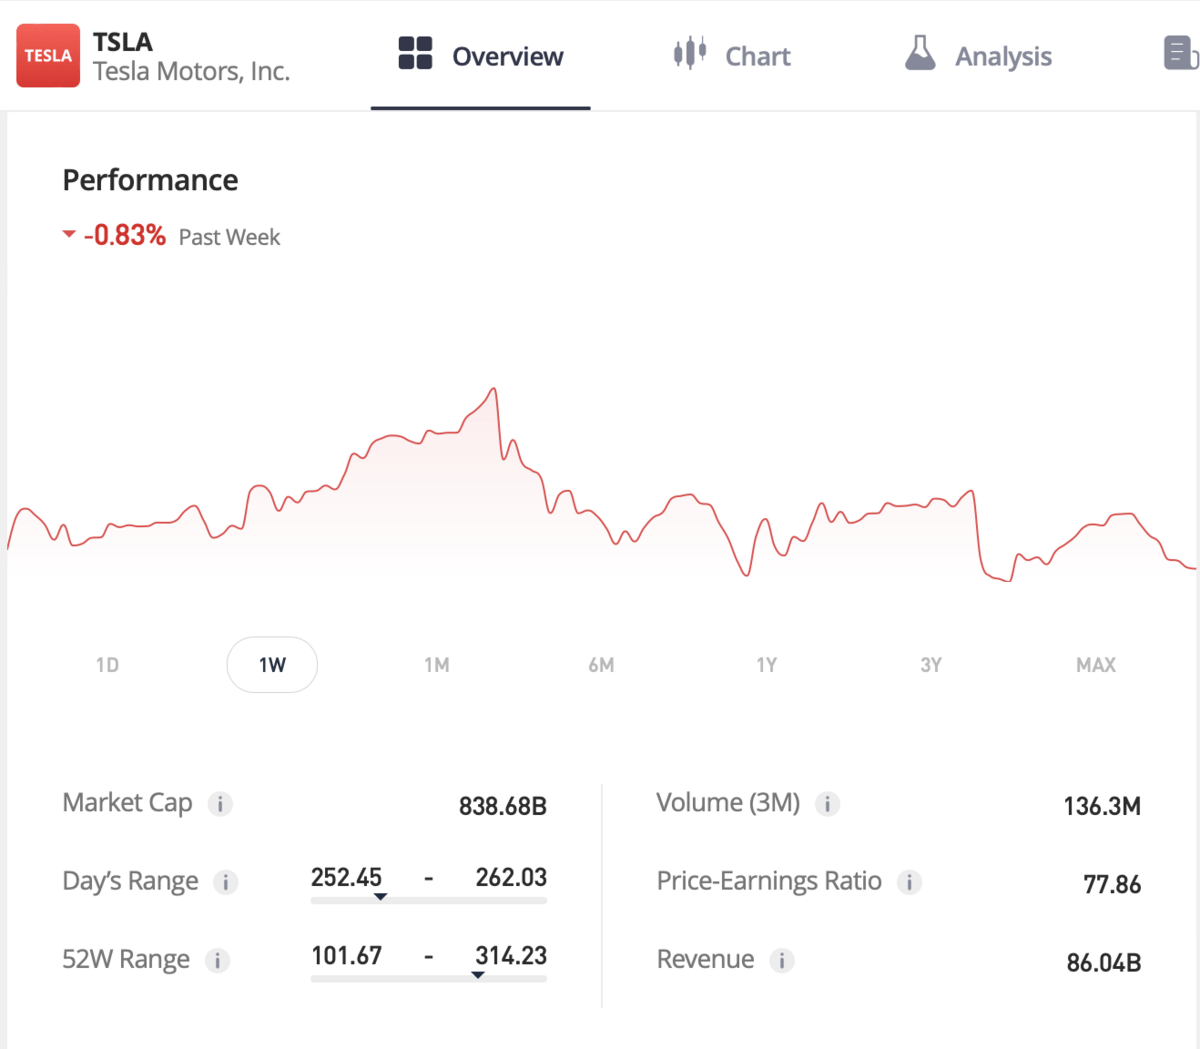
Stock Quote on eToro
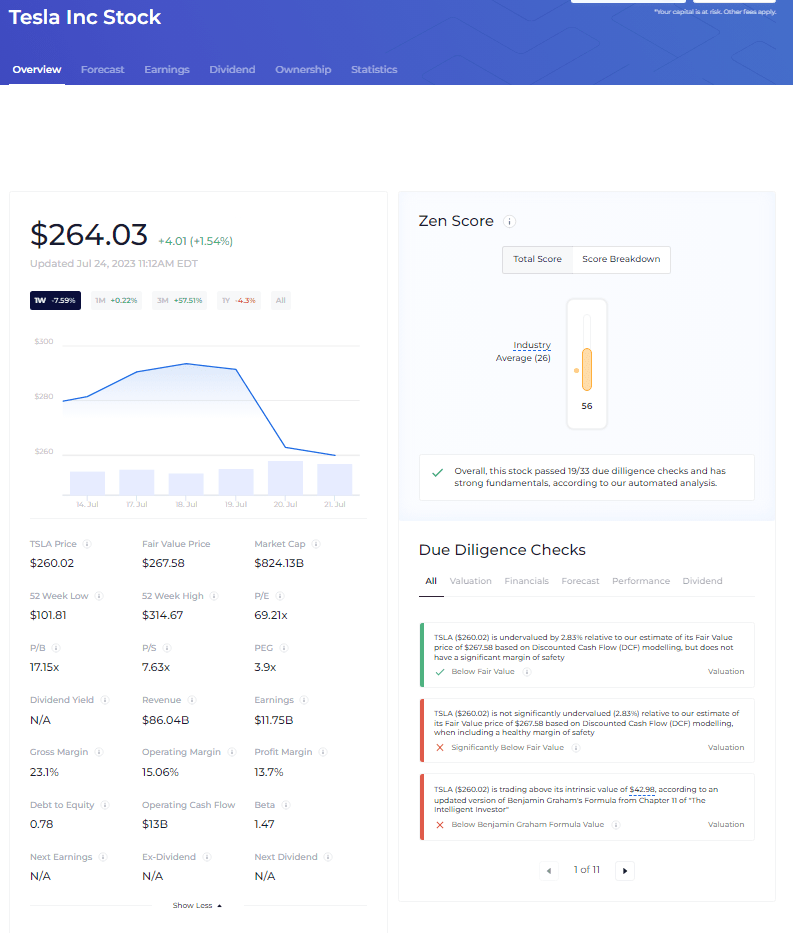
Apart from offering a rather clean-looking stock quote featuring a collection of 6 key metrics on the default setting, eToro is an online trading platform best known for its integration of some social media functionality.
On eToro, you can both trade and discuss your strategies with traders and investors the whole world round. Its CopyTrader feature lets you follow (and copy, if you like) the trades of professional traders. All you have to do is select your favorite trader(s) and let the app do the rest.
Here’s how the stock quote for Tesla (NASDAQ: TSLA) looks on eToro:
eToro is a multi-asset platform which offers both investing in stocks and cryptoassets, as well as trading CFDs.
Please note that CFDs are complex instruments and come with a high risk of losing money rapidly due to leverage. 61% of retail investor accounts lose money when trading CFDs with this provider. You should consider whether you understand how CFDs work, and whether you can afford to take the high risk of losing your money.
This communication is intended for information and educational purposes only and should not be considered investment advice or investment recommendation. Past performance is not an indication of future results.
Copy Trading does not amount to investment advice. The value of your investments may go up or down. Your capital is at risk.
Crypto investments are risky and may not suit retail investors; you could lose your entire investment. Understand the risks here https://etoro.tw/3PI44nZ
Don’t invest unless you’re prepared to lose all the money you invest. This is a high-risk investment and you should not expect to be protected if something goes wrong. Take 2 mins to learn more
eToro USA LLC does not offer CFDs and makes no representation and assumes no liability as to the accuracy or completeness of the content of this publication, which has been prepared by our partner utilizing publicly available non-entity specific information about eToro.
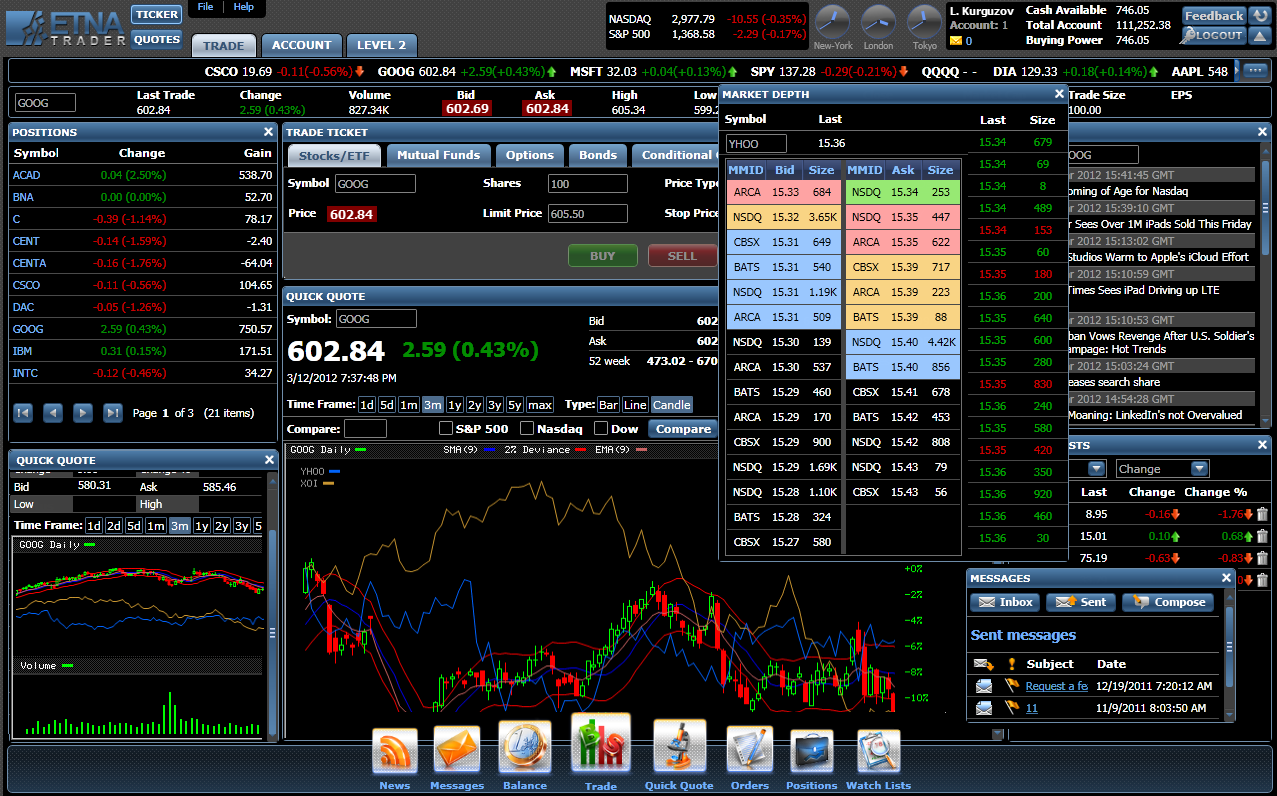
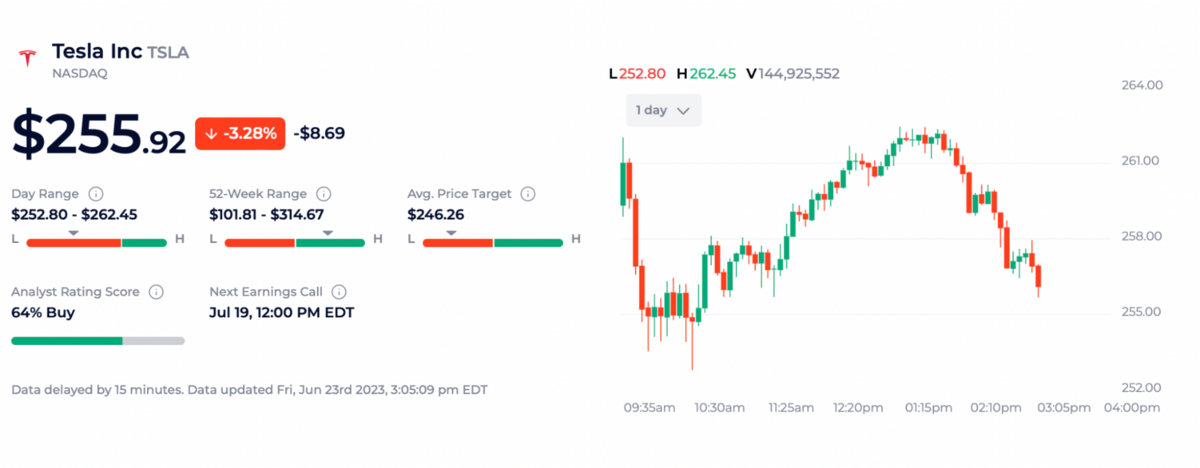
Stock Quote on TradeStation
While TradeStation’s quote offers a limited (if crucial) selection of metrics, the stock’s page goes a bit more in-depth and gives more insights including additional information on the company’s earnings.
You can read more on our TradeStation review, but one of the platform’s outstanding features is its software which boasts lightning-fast executions making it a great place to be if your approach is highly time-sensitive — ie, it’s a great platform for day traders.
It also offers access to numerous assets including stocks, options, futures, exchange-traded and mutual funds, bonds, and some cryptocurrencies.
Here’s how a stock quote looks on TradeStation:
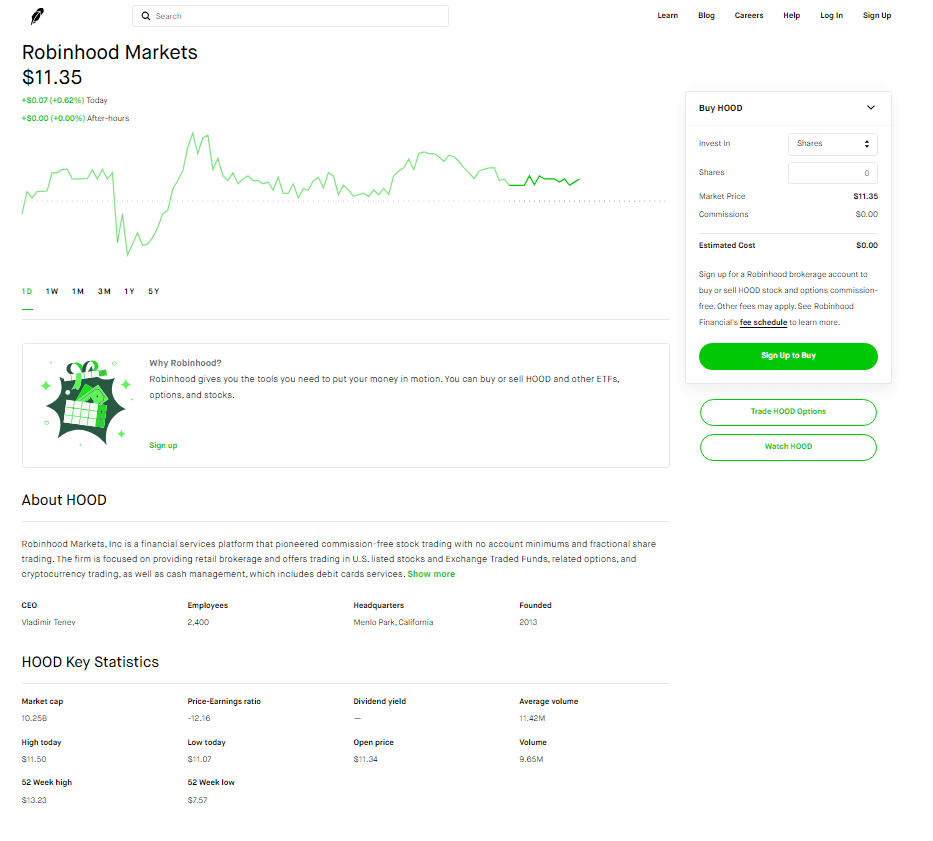
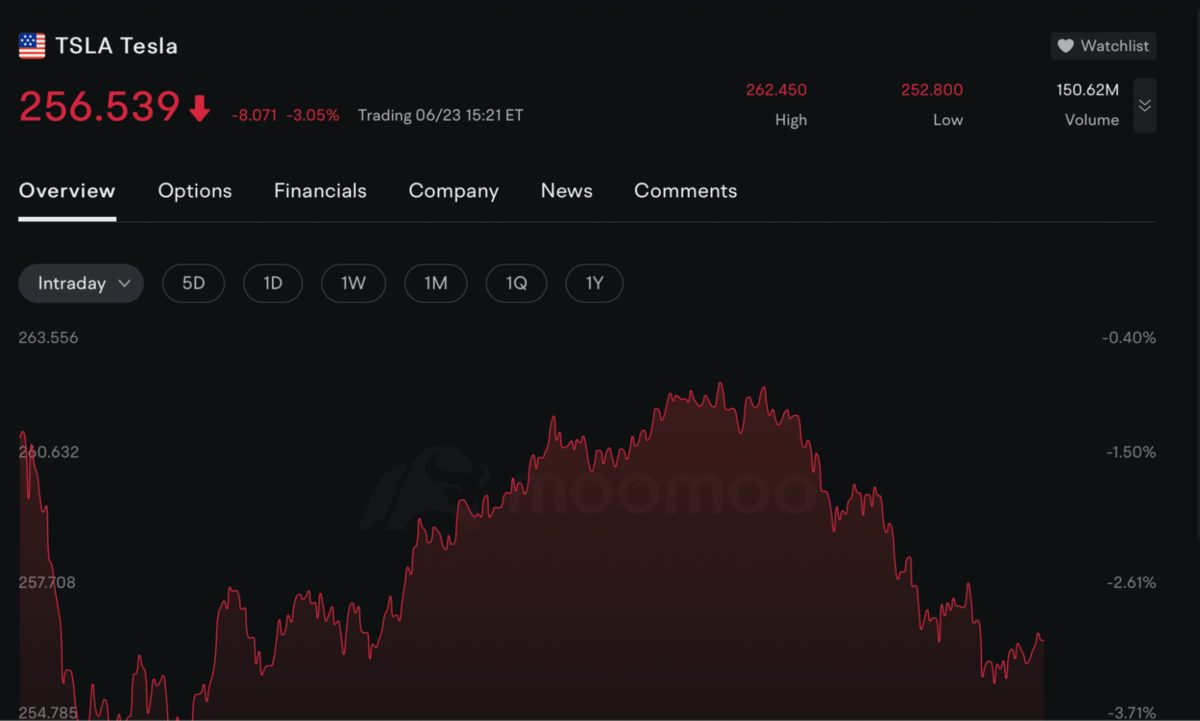
Stock Quote on moomoo
Trading on moomoo requires an app (for desktop, or mobile), but its stock quote is readily available through your browser.
Don’t let the barebones appearance of the quote fool you as one of this platform’s outstanding features is the free access to level 2 market data it offers.
The platform itself is generally considered best for beginner and intermediate active traders. It offers a decent selection of features, but does not have an exhaustive list of assets.
moomoo has one of the best new-account promos out there:
Take Your Stock Research Further With WallStreetZen
If you are looking to access high-quality and informative stock quotes, check out WallStreetZen.
On WallStreetZen, you can go beyond stock quotes with key information so that you can get a succinct analysis of some of the important aspects of the company.
While stock quotes are great and actually offer a ton of information once you know what every metric is, you can’t exactly build your entire strategy based on them alone.
That’s why we take it a step further. We track 4K+ top stock analysts + distill dozens of due diligence checks into easy-to-understand data, making for easier research and higher-conviction investments for you.
Final Word: How to Read a Stock Quote
Learning how to read a stock quote is immensely useful for traders. Stok quotes offer quick insight and a convenient way to easily compare multiple companies. They can tell you a lot in a little time.
However, while mastering how to read stock quotes is a crucial step for traders, it is just a piece of your investing journey. They’re always useful, but they’re an invitation to explore more — not a definite buy signal.
Moomoo is a financial information and trading app offered by Moomoo Technologies Inc. Securities are offered through Moomoo Financial Inc., Member FINRA/SIPC. The creator is a paid influencer and is not affiliated with Moomoo Financial Inc. (MFI), Moomoo Technologies Inc. (MTI) or any other affiliate. The experiences of the influencer may not be representative of the experiences of other moomoo users. Any comments or opinions provided are their own and not necessarily the views of MFI, MTI or moomoo. Moomoo and its affiliates do not endorse any strategies that may be discussed or promoted herein and are not responsible for any services provided by the influencer. This advertisement is for informational and educational purposes only and is not investment advice or a recommendation of a security or to engage in any investment strategy. Investing involves risk and the potential to lose principal. Investment and financial decisions should be made based on your specific financial needs, objectives, goals, time horizon and risk tolerance. Any images shown are strictly for illustrative purposes. Past performance does not guarantee future results. U.S. residents trading in U.S. securities may trade commission-free using the moomoo app through Moomoo Financial Inc. (MFI). Please see our pricing page for other fees. Level 2 data is free to moomoo users that have an approved MFI brokerage account. Trading during Extended Hours Trading Sessions carries unique risks, such as greater price volatility, lower liquidity, wider bid/ask spreads, and less market visibility, and may not be appropriate for all investors.
FAQs:
How do you read stocks for beginners?
The quickest way to gain some insight into a stock is by using a quote. The stock quote offers quick insight into an asset’s performance by telling you its price, volume, price changes, the company’s earnings reports and dividend dates, and much more.
Stock quotes usually also feature a chart offering you a way to visualize the performance of the said asset.
What does the stock quote tell you?
The stock quote offers quick insight into key data points for an asset. While there are dozens of types of information that can be found in a quote, they almost universally tell you the name of the asset, the market it is traded on, the current price as well as how it changed within a certain timeframe, the volume, and the market cap.
What do the numbers mean in the stock market?
While there are numerous numbers expressing numerous types of information on the stock market, there are several most common ones.
These include the current price of a stock, its highest and lowest prices in a day and in a year, the number of shares traded at a given time (known as volume), the value of all available shares (the market cap), and the amount per share paid to investors in fixed timed intervals (yield).
Where to Invest $1,000 Right Now?
Did you know that stocks rated as "Buy" by the Top Analysts in WallStreetZen's database beat the S&P500 by 98.4% last year?
Our May report reveals the 3 "Strong Buy" stocks that market-beating analysts predict will outperform over the next year.