Lincoln is an investor and content marketer. He has worked for financial advisors, institutional investors, and a publicly-traded fintech company. Lincoln holds degrees in Finance, Economics, and Accounting.
The best charting app & broker for head and shoulders patterns…
If you’re looking for a stock charting app, there’s a good chance that you’re also looking for a broker. TradeStation has the best free charting software on the market – and if its proprietary charts aren’t enough for you, it integrates fully with TradingView! That means you can use TradeStation for your broker and make trades directly from a TradingView chart.
But TradeStation’s in-house charts shouldn’t be overlooked. Its custom-built tools include:
- Chart Analysis – a multi-function window where you can look up price data, perform technical analysis, back-test and automate strategies, and show orders and positions
- RadarScreen – one of the most specced-out stock screeners available, featuring alerts and real-time watchlists with 329 criteria built in
- Matrix – this takes all of the tools typically featured alongside charts (a market depth window, buy and sell signals, and an order-entry tool) and puts them into one window
Sign up for TradeStation here.
“Where you want to be is always in control, never wishing, always trading, and always, first and foremost protecting your butt.”
Paul Tudor Jones
The best traders in the world only take trades where they are extremely confident in the direction of the stock. These traders allow hundreds of good setups to pass them by as they wait for the perfect setup. By doing so, they can control their risk-to-reward ratio in each trade.
One of the most reliable trends to trade is the head and shoulders pattern.
The head and shoulder trading pattern is easy to identify and can be used to enter a bearish position after a bullish trend. It’s identified with three peaks and indicates an upward trend is coming to an end.
Let’s jump in to discuss the head and shoulder pattern components, pros and cons, and how to utilize this strategy for trading success.

What Is a Head and Shoulders Pattern?
The head and shoulders stock pattern is a common tool to help identify the fall of a previously rising stock. As such, it is a bearish pattern that signals a reversal.
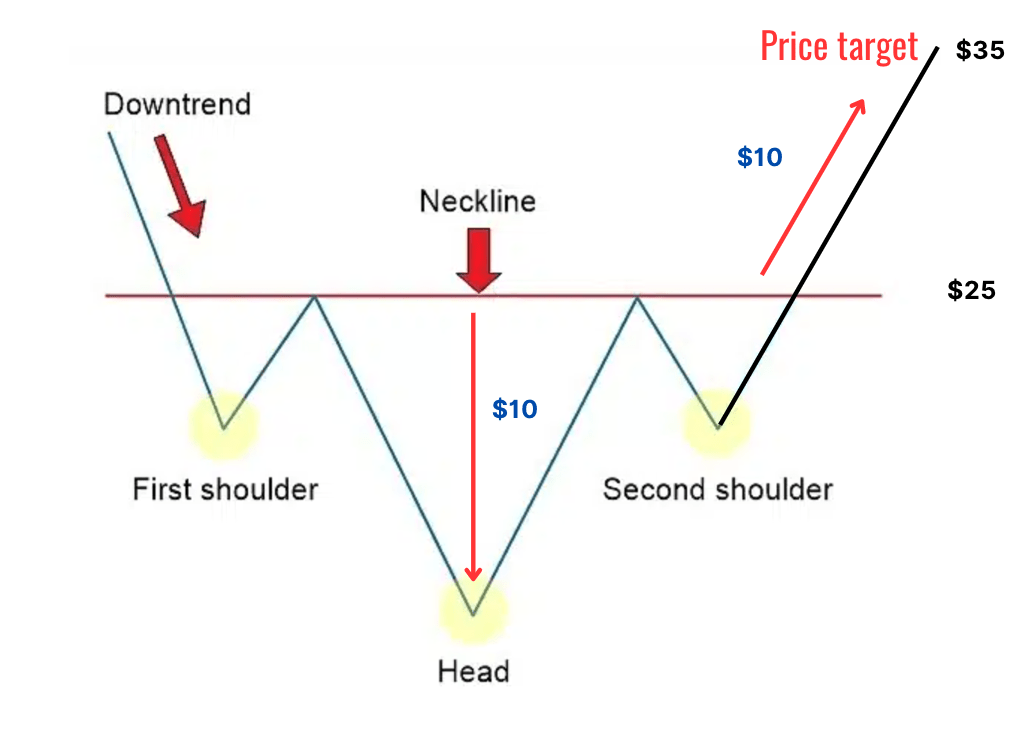
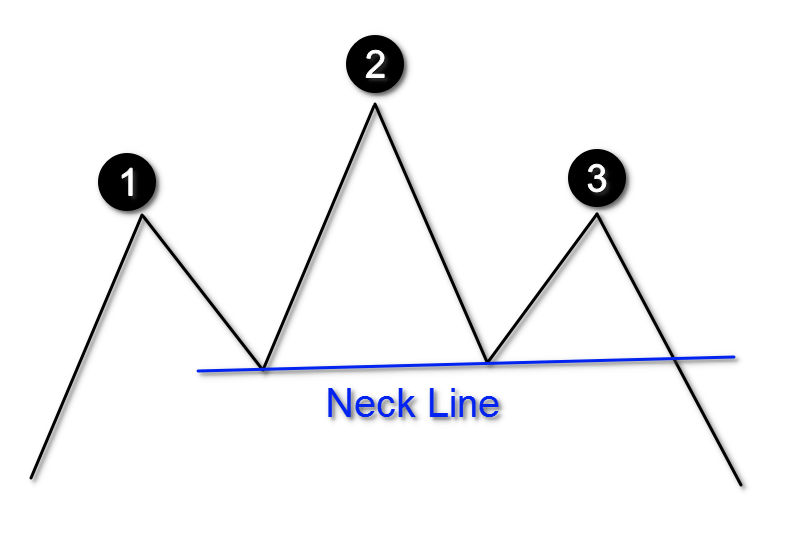
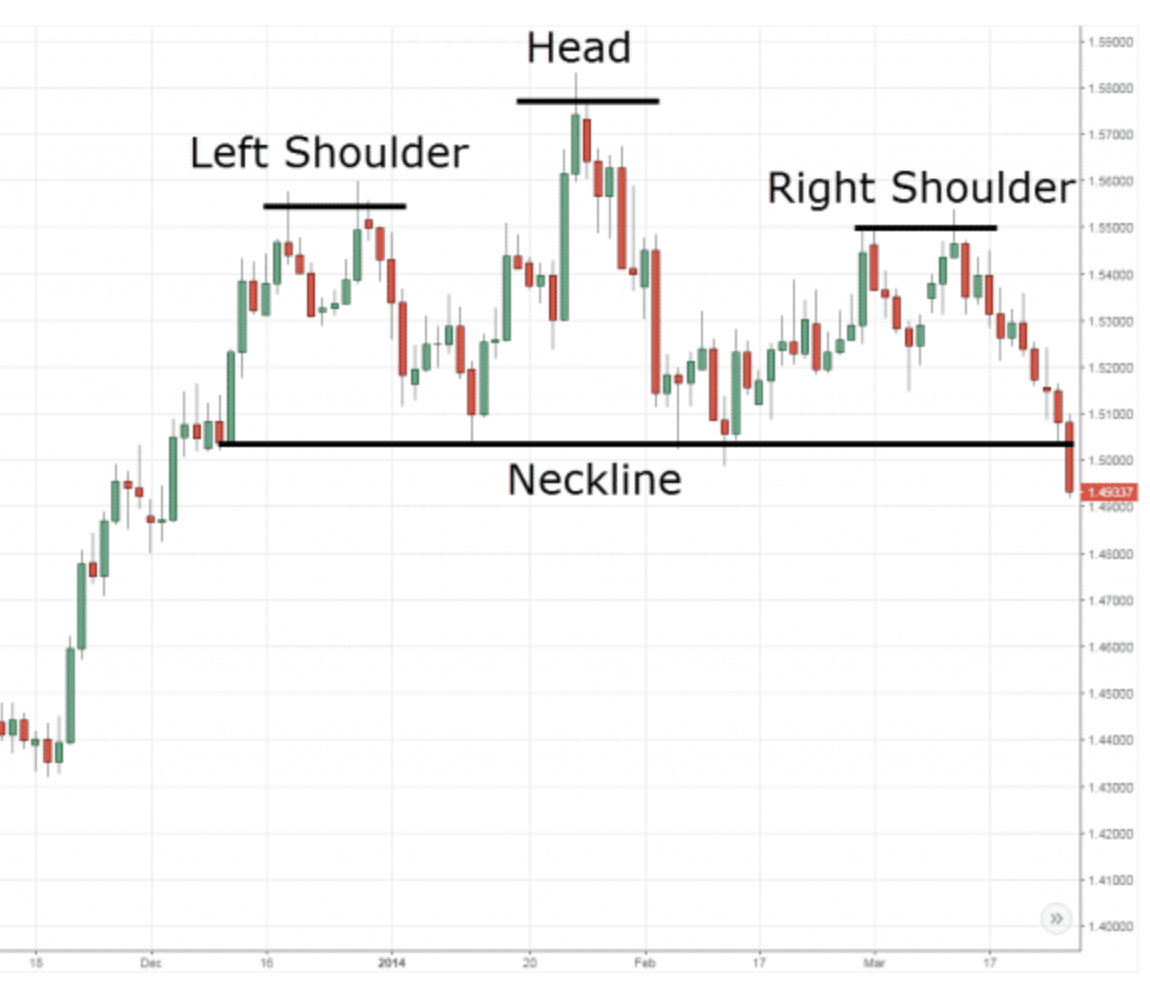
There are four main components of the head and shoulders pattern shown in the image below. The different peaks created look like a left shoulder, head and right shoulder.
The head and shoulders pattern is a reversal trend, indicating price movement is changing from bullish to bearish.
The pattern is never perfect in shape, as price fluctuations can happen in between the shifts.
The Components of a Head and Shoulders Trading Pattern
Let’s take a look at the four components that make up the formation.
- Left Shoulder – This first peak is formed after a bullish run and high trading volume. The decline forms into a trough and looks like a ‘shoulder.’
- Head – The head is formed as prices rise above the left shoulder peak, then begin to decline again.
- Right Shoulder – Prices rise again, similar to the left shoulder peak level, before declining once more.
- Neckline – The line connecting the first and third trough. The neckline is the level of support or resistance traders use to determine placing an order.
The image above shows the most critical point in the head and shoulders trading pattern setup.
After completing the right shoulder, prices are falling below the neckline, indicating further price declines. The breaking of the neckline here signals your entry point into a bearish position.
You might be interested in Investors Underground, a day trading community with exceptional educational materials.
IU offers 3 trading courses with a track record of transforming brand-new traders into full-time trading professionals.
How to Trade a Head and Shoulders Pattern
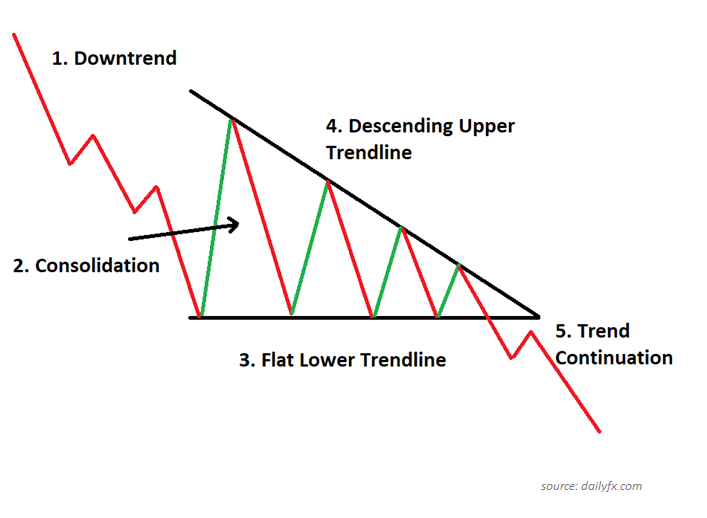
It’s important to remain patient and wait for price action to break the neckline after the right shoulder, allowing the pattern to form completely. A descending triangle on the right shoulder can provide further confirmation of a bearish trend.
Entering a short position is a way to capitalize on a declining price. How does this work? First you borrow shares of a stock from your broker to sell at the market price. Then you purchase the shares back at a lower price to return back to the broker. The profit is in the amount the stock has declined. Check out how do investors borrow shares for an explanation of this process.
Here are three steps to execute a short sale:
- Set a stop order – this is for protection in case the stock moves above a set price.
- Enter the short position.
- Close out the position at the price target.
To determine a price target, measure the distance from the top of the head down to the neckline. This is your spread. If the spread is $10, you’d be able to estimate that the stock price may decline $10 below the neckline level.
Let’s put it all together: Stock ABC just formed the right shoulder and is trading at $35 per share, the neckline. After confirmation of it breaking below $35, you borrow 100 shares and sell them short for $3,500. The share price moves from $35 to $25, where you purchase 100 shares to replace what was borrowed.
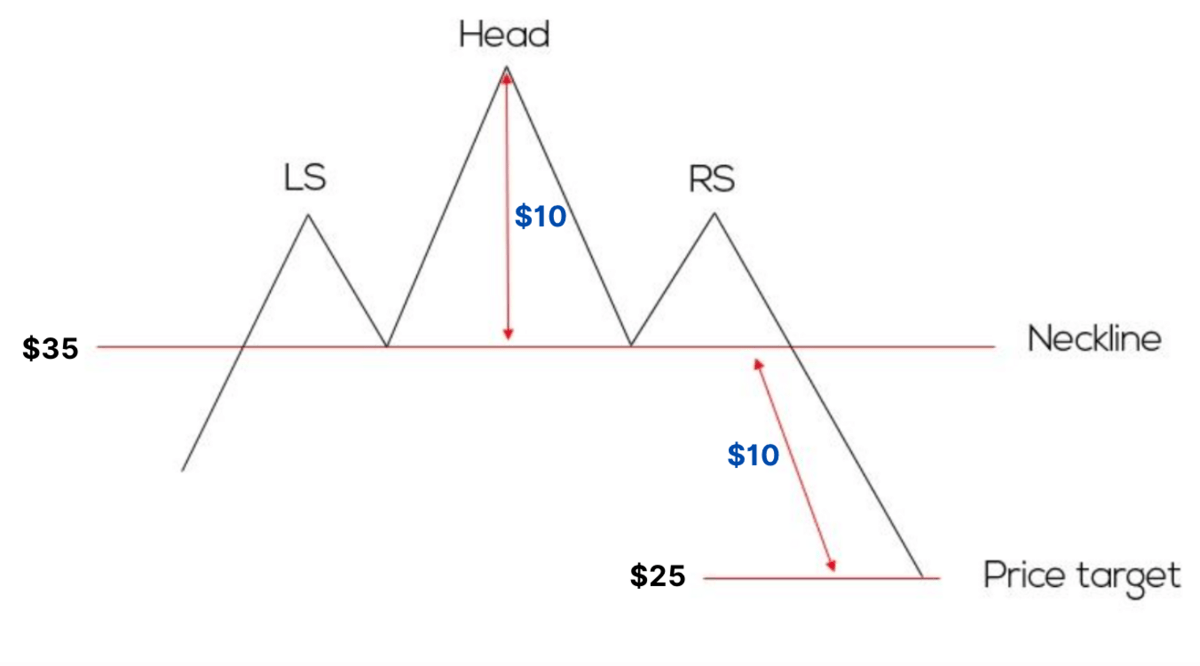
The profit is 100 x $10 = $1,000.
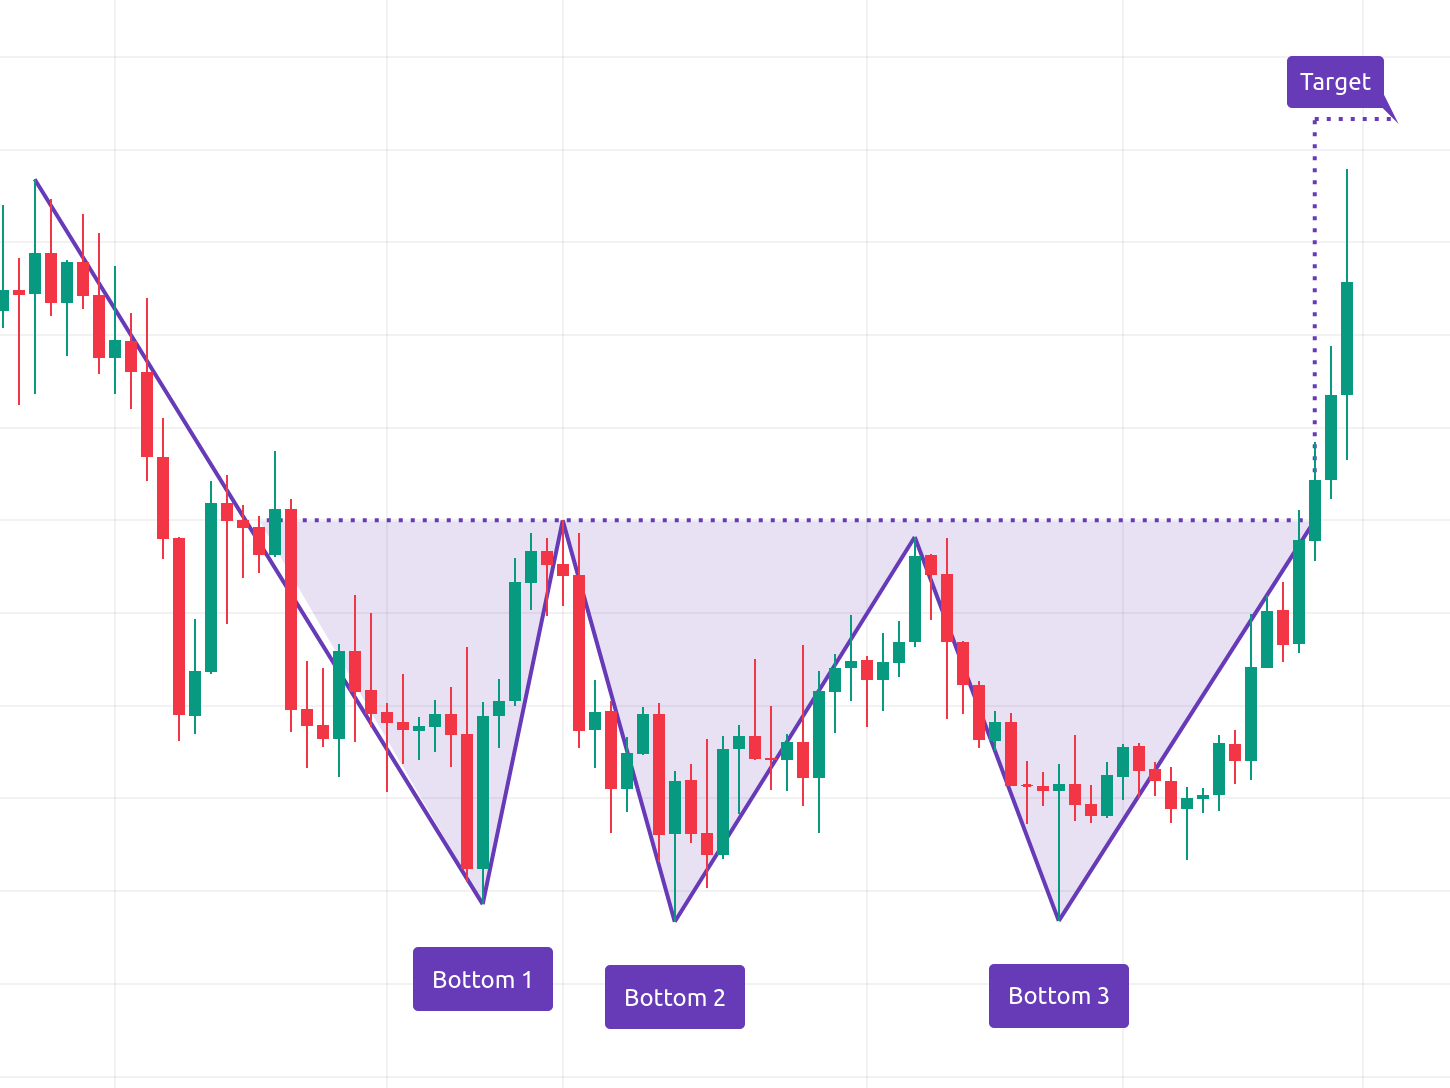
What Is an Inverse Head and Shoulders Pattern?
An inverse head and shoulders pattern is a mirror of the head and shoulders pattern. As such, it’s sometimes referred to as a head and shoulders pattern reversal.
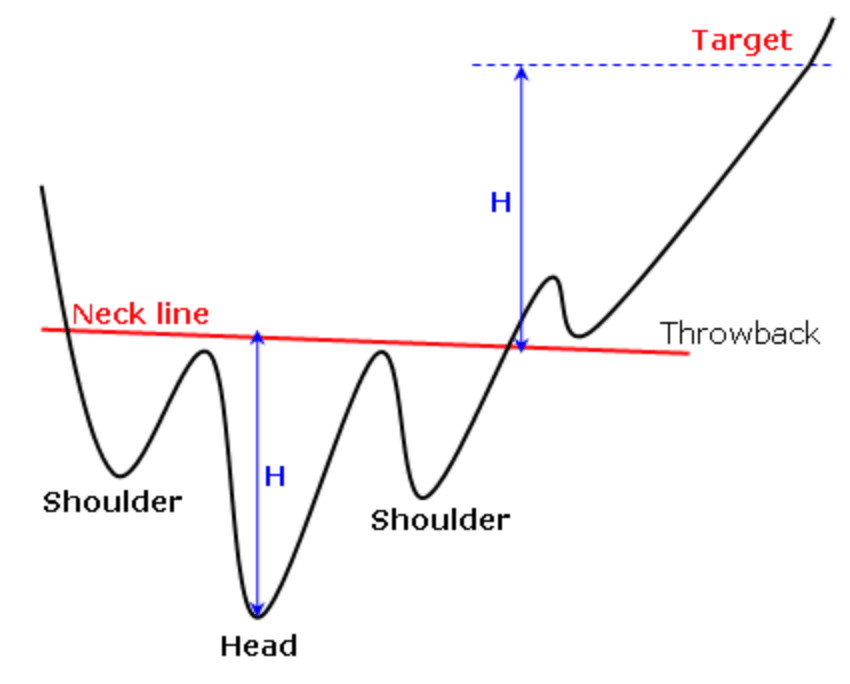
While the traditional head and shoulders pattern is seen at the peak of the market, the inverse will be at the bottom. Therefore, this is a bearish to bullish strategy. Here are the components:
- Left Shoulder – A price decline bottoms out, followed by a price increase.
- Head – The head is formed as prices decline below the left shoulder peak, then begin to increase again.
- Right Shoulder – Prices decline again, similar to the left shoulder peak level, before increasing once more.
- Neckline – The line connecting the first and third trough. The neckline is the level of support or resistance traders use to determine placing an order.
The Ultimate Day Trading Setup
- The best brokerage for day trading: TradeStation
- The best day trading ecourses & community: Investors Underground
- The best day trading computer: Radical X13
- The best charting platform: TradingView
How to Trade an Inverse Head and Shoulders Pattern
Similar to the traditional head and shoulders pattern, allowing the neckline to form will help to determine where to place a stop order. The inverse pattern is an upward trend so the stop can be placed just below the right shoulder.
The price target will be the difference between the head and neckline. This figure can be added to the neckline to determine the price target.
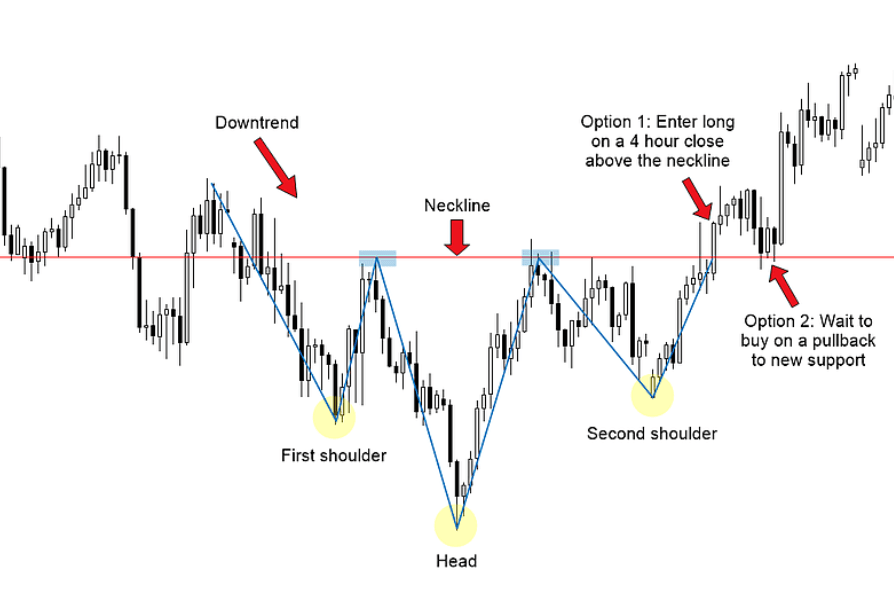
As seen in the image above, the price may fall back to the neckline to find support before going higher. If this is the case, traders have a 2nd potential entry point.
Pros and Cons of Trading a Head and Shoulder Pattern
Pros | Cons |
Easy to identify for experienced traders | Pattern isn’t always perfect, novice trader may overlook |
Profit opportunity in all markets | Long wait periods for patterns to develop |
Historically reliable trading pattern | Patterns can be subjective |
How Reliable Is a Head and Shoulder Trading Pattern?
The head and shoulders stock pattern is one of the most reliable patterns according to market analysts. By identifying the neckline, you can use logic to determine entry points and identify price reversals.
That said, most traders will not trade based on the head and shoulders pattern alone – they will confirm the chart pattern with volume indicators or other technical analysis tools.
Final Word: Head and Shoulders Pattern
The head and shoulders pattern helps traders identify price reversals to spot profit opportunities. While it’s preferred both shoulders are symmetrical, this is not a requirement so allowing the pattern to develop and identifying the neckline are the most critical factors. The head and shoulders pattern is one of many indicators I’d recommend any investor incorporating into their trading strategy.
FAQs:
Is a head and shoulders pattern bullish?
The head and shoulders pattern is a bearish pattern and signals a reversal from upward to downward price movement.
Is head and shoulder bullish or bearish?
Head and shoulder is a bearish pattern. After the formation of three peaks and the breaking of the neckline, the stock is expected to head lower.
What is the meaning of head and shoulders pattern?
The head and shoulders pattern is named such because of the visual pattern it forms: a left shoulder, head, right shoulder and neckline.
What happens after a head and shoulders pattern?
After a head and shoulders pattern forms, the price will move lower after breaking through the neckline.
Where to Invest $1,000 Right Now?
Did you know that stocks rated as "Buy" by the Top Analysts in WallStreetZen's database beat the S&P500 by 98.4% last year?
Our July report reveals the 3 "Strong Buy" stocks that market-beating analysts predict will outperform over the next year.