Lincoln is an investor and content marketer. He has worked for financial advisors, institutional investors, and a publicly-traded fintech company. Lincoln holds degrees in Finance, Economics, and Accounting.
The best charting app & broker for descending triangle patterns…
If you’re looking for a stock charting app, there’s a good chance that you’re also looking for a broker. TradeStation has the best free charting software on the market – and if its proprietary charts aren’t enough for you, it integrates fully with TradingView! That means you can use TradeStation for your broker and make trades directly from a TradingView chart.
But TradeStation’s in-house charts shouldn’t be overlooked. Its custom-built tools include:
- Chart Analysis – a multi-function window where you can look up price data, perform technical analysis, back-test and automate strategies, and show orders and positions
- RadarScreen – one of the most specced-out stock screeners available, featuring alerts and real-time watchlists with 329 criteria built in
- Matrix – this takes all of the tools typically featured alongside charts (a market depth window, buy and sell signals, and an order-entry tool) and puts them into one window
Sign up for TradeStation here.
This is the last article you’ll need to read on descending triangle patterns.
You’ve already scoured Google, but the answers are unclear and incomplete – some authors claim the pattern is bearish, and some don’t.
So which is it?
The truth is the pattern can express bullish or bearish sentiment.
We’ll explain in detail exactly what the formation represents and, more importantly, how it can help you make more intelligent trade decisions.
I’ll answer your most pressing questions, including:
- What is a descending triangle pattern?
- How do you identify the pattern?
- How can this technical tool be used to improve trade decisions?
- When do you enter and exit positions?
Fortunately, regardless of the direction the formation implies, profitable trades can be produced using this charting technique.
Whether bullish or bearish, a descending triangle pattern is a tried and tested approach that helps traders make more informed, consistent, and ultimately, profitable trades.
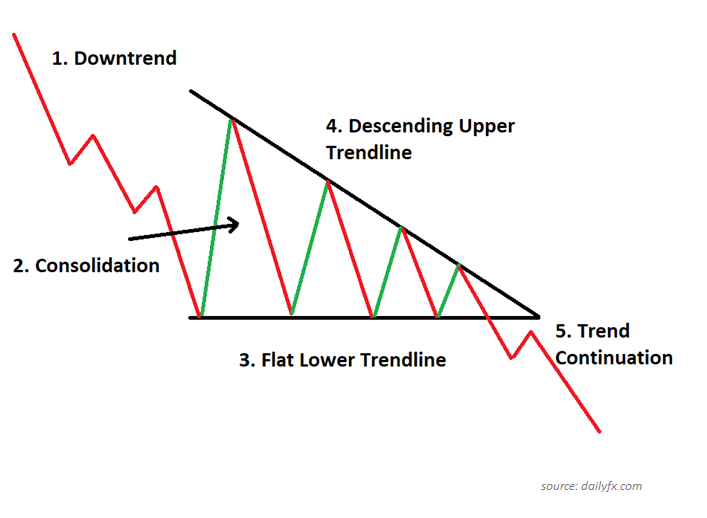
What Is a Descending Triangle Pattern?
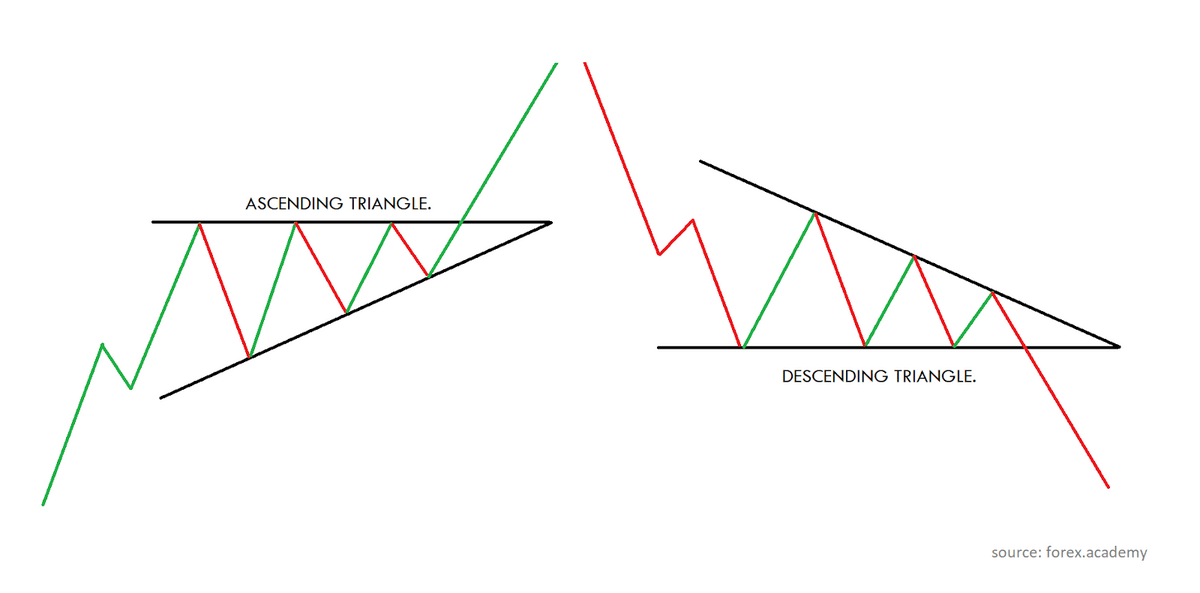
A descending triangle pattern is a price chart formation used in technical analysis. Like the ascending triangle pattern, its descending counterpart is produced by drawing two lines that converge to create the appearance of a triangle. At a minimum:
- The upper line must connect two price highs.
- The lower line must connect two price lows.
A descending triangle pattern is typically considered a bearish continuation pattern. When the pattern forms, it suggests a security’s price will likely continue trending in the same direction (in this case, lower).
However, at times – as we’ll explain later – descending triangles can express a bullish signal in the form of a reversal pattern.
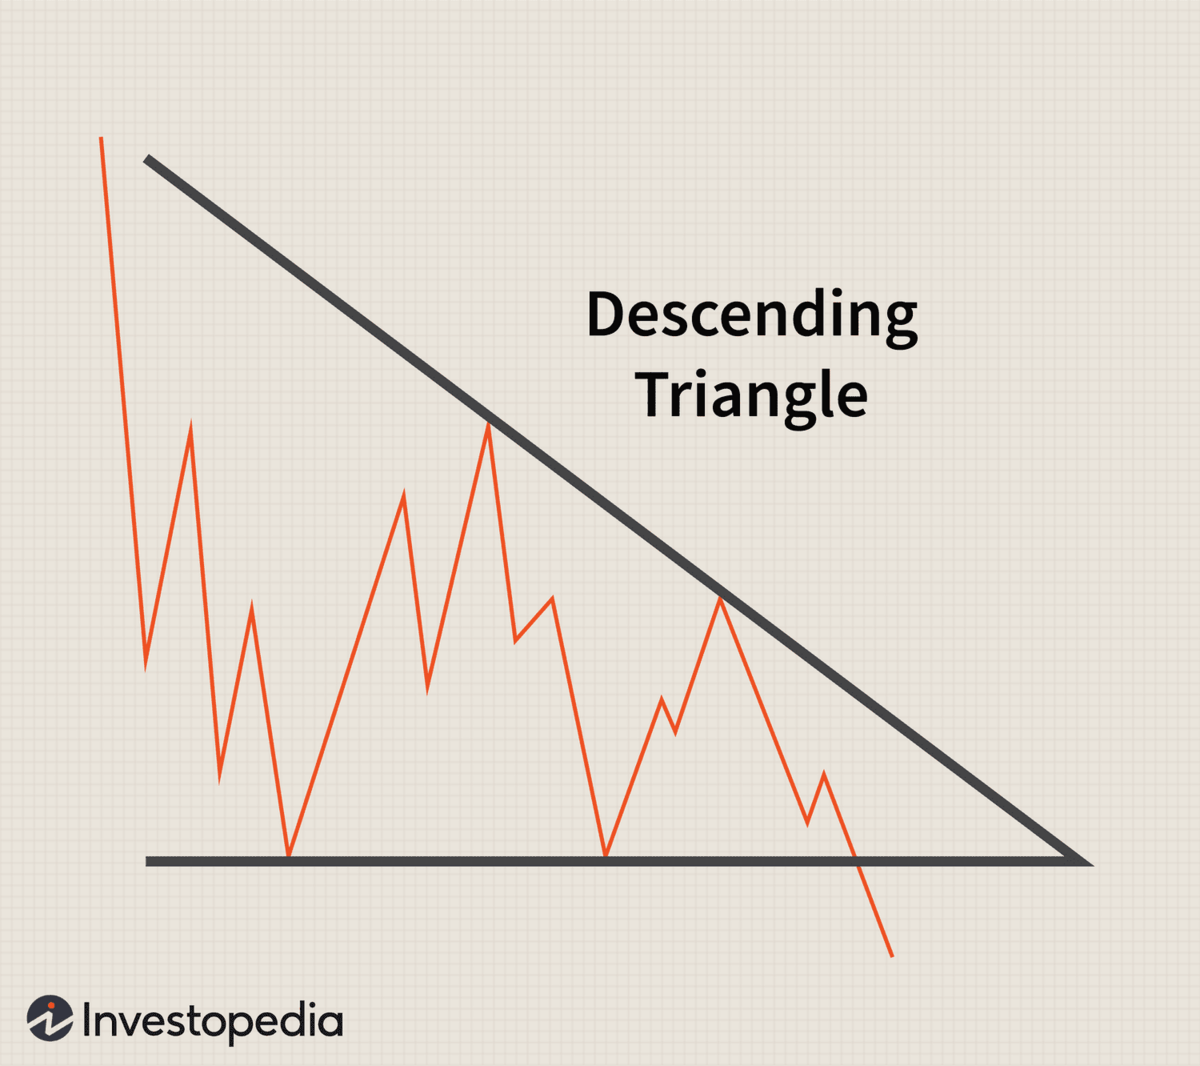
- A trend line that connects increasingly lower highs (the line will slope down and to the right over time). This is known as the resistance level, where the price typically peaks before beginning to lower again.
- A second horizontal line that connects the series of price lows. This is known as the support level, the lowest price the stock has fallen within the charting pattern.
Usually, a descending triangle pattern is considered a bearish formation as the price is trending lower.
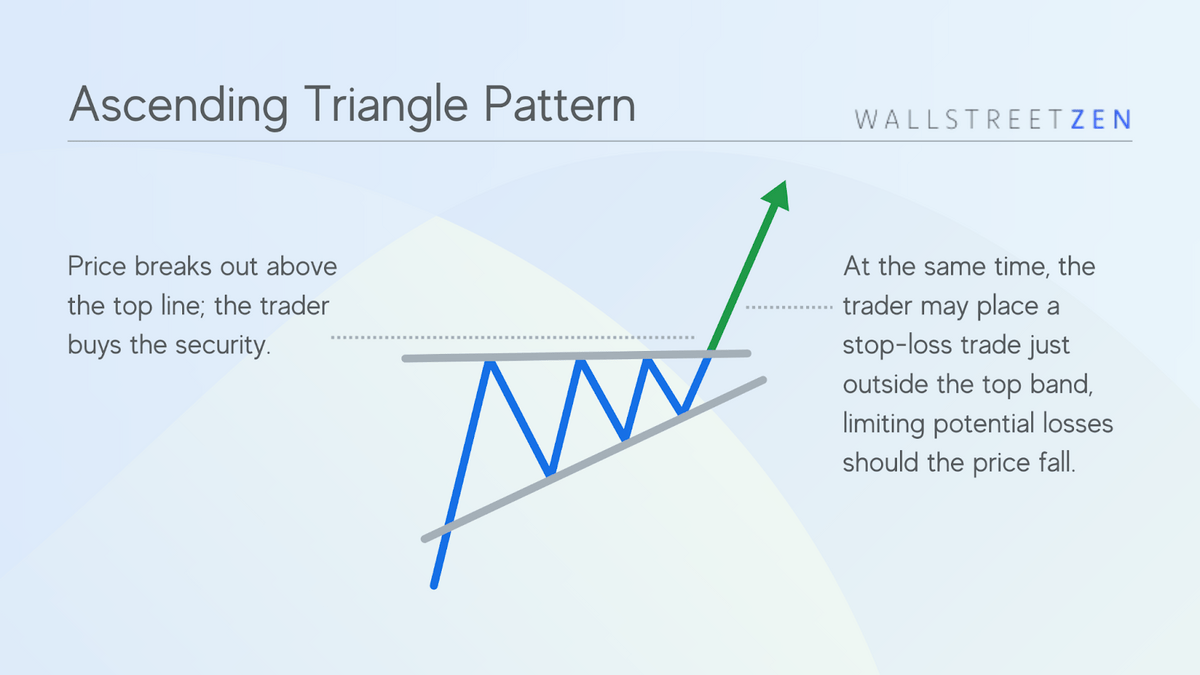
This contrasts with an ascending triangle, which is largely a bullish formation.
While these assumptions are often valid, sometimes triangle patterns can produce signals counter to their typical signal.
How to Spot a Descending Triangle Chart Pattern
Spotting a descending triangle chart pattern can be as much of an art as a science.
A perfect charting pattern doesn’t exist. While straight lines are used to trace the highs and lows, most likely, if the line truly followed the actual price peaks and troughs, it would be bumpy.
Take the following snapshot from a chart representing the price of the Euro relative to the British Pound:
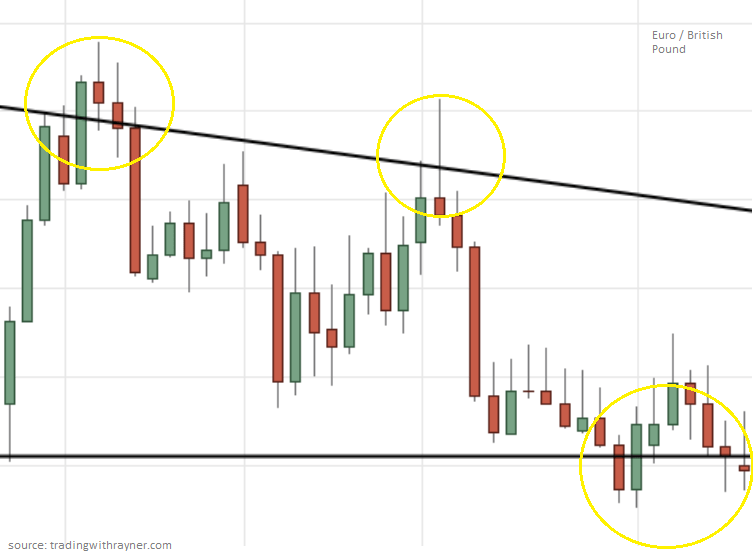
The actual lines do not intersect perfectly with each peak and trough. Instead, the line represents an approximation.
The exact placement of the lines may vary between traders. Over time, your ability to discern where the line should be placed will improve through repetition.
Said another way, charting pattern identification is often the result of experience – the more you trade, the better you become at identifying patterns.
Of course, stock charting tools are invaluable as well.
Traders can monitor alerts that notify them of changes in direction, for example, potentially revealing a new top or bottom. The trader might then take this new information and verify if the price chart resembles a descending triangle.
Ultimately, experience coupled with advanced technical tools offers traders the best chance of generating successful trade outcomes.
Let’s briefly walk through how you might identify the pattern in the first place using the same Euro / British Pound chart from above:
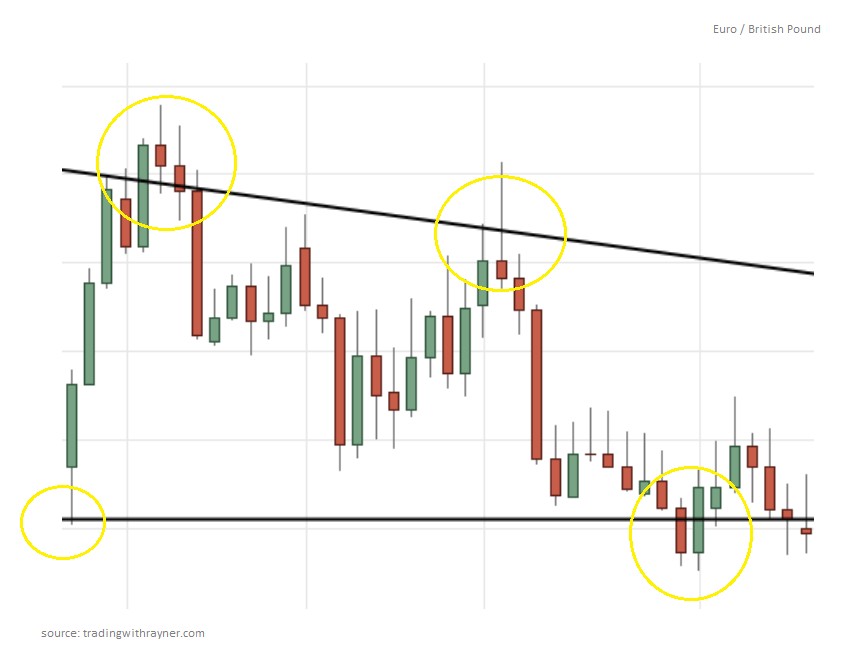
As previously mentioned, the formation requires at least two highs and two lows. Not only that, you need to identify increasingly lower highs along with relatively consistent lows.
As you can see in the chart, the price of the Euro relative to the British Pound hit the same bottom twice before rebounding. The rebounds, however, led to a lower subsequent high.
The yellow circles represent the identified highs and lows which meet the criteria of a stocks descending triangle pattern formation. As a result, the top resistance line and bottom support line were drawn, forming the pattern.
How to Trade a Descending Triangle
Once a descending triangle formation has been identified, a trader can monitor the stock for indicators of likely future moves. At a minimum, two price lows and two price highs are required to produce the formation.
Typically, traders that leverage this tool monitor the stock’s price, waiting for a breakout.
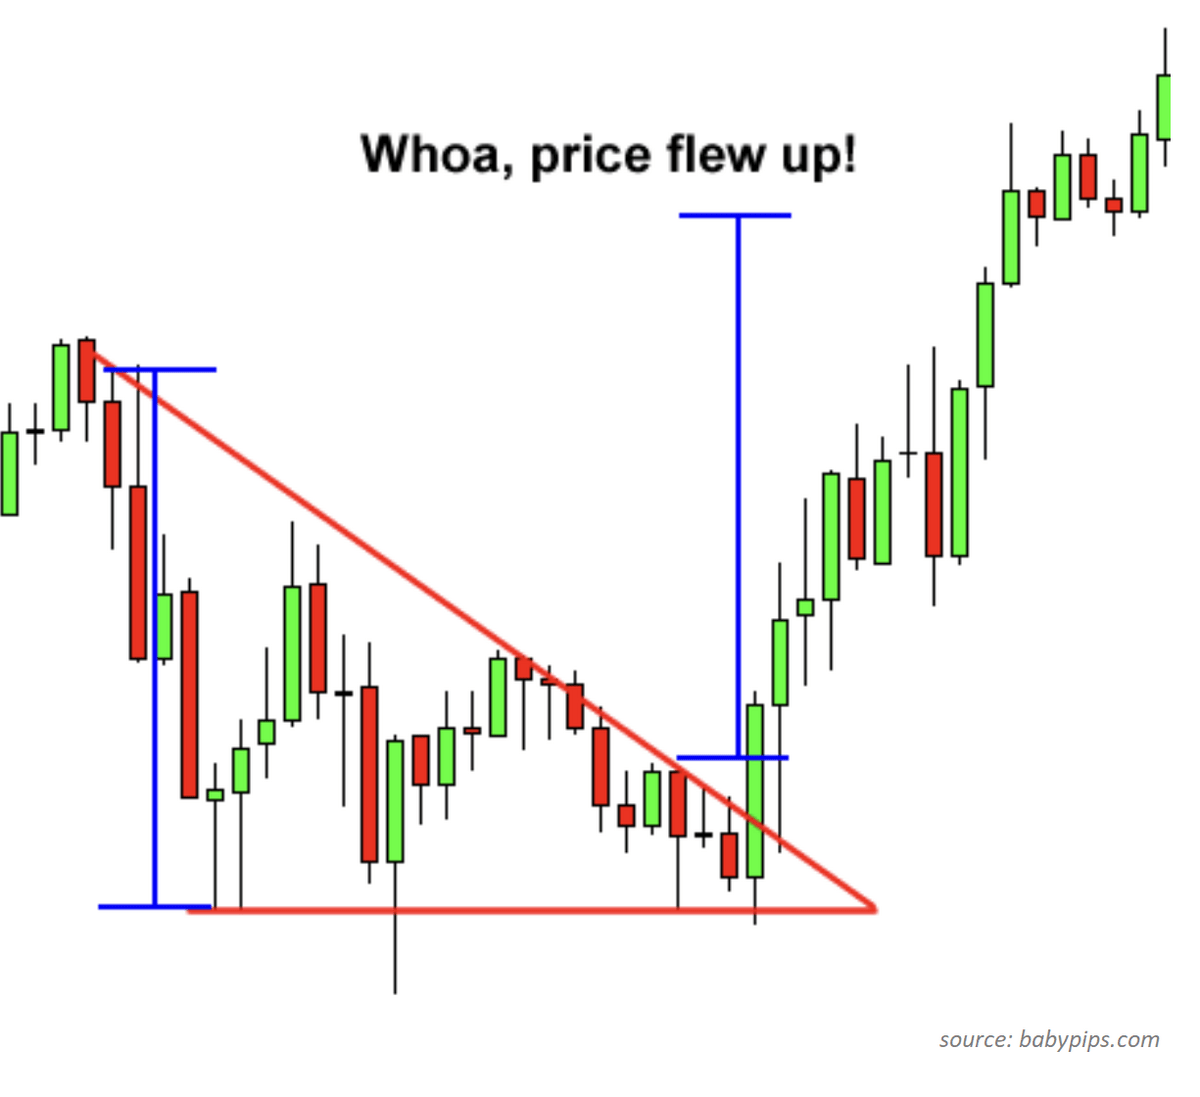
A breakout is when a stock’s price moves out of the established triangle pattern. Breaking out implies pressure has been generated that could indicate the price will continue to persist in the same direction as the breakout.
Because a descending triangle pattern is considered bearish, when the price of a stock breaks the support line from above, this technical tool suggests the price will continue to fall. Descending triangles assume that momentum will drive a stock price lower when it breaks this milestone level.
When a support line is breached, you may decide to enter a short position.
Great. You’ve entered a short position. Now what? When do you exit?
To find your price target, take the thickest portion of the triangle and subtract it from the breakout point.
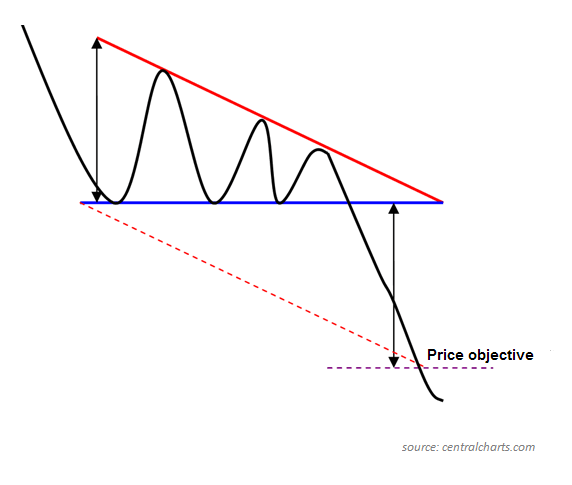
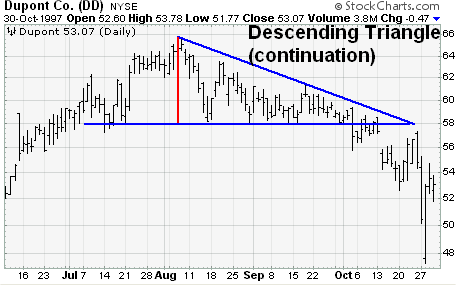
Take the following Dupont example. In the chart, Dupont’s price eventually breakouts below the support line from above. Accordingly, the price is expected to continue to fall, but to what depths?
In this example, the red line represents the thickest part of the triangle. The red line spans approximately $8 in price ($66 less $58).
As a result, when the price breaks out below the $58 support line, a short position is entered with a price target of $50.
Let’s recap what this trade decision might look like from start to finish.
- Dupont price highs are trending down over time, while the price lows remain relatively consistent. Therefore, a descending triangle pattern has been identified.
- The formation emerges with a $58 support line (bottom horizontal line).
- Price of Dupont ultimately breaks out of the $58 support line.
- Stock is shorted until it falls to $50, at which point the position is closed (shares are repurchased to close the short position).
Tools Every Trader Needs
- The best brokerage for day trading: TradeStation
- The best day trading ecourses & community: Investors Underground
- The best day trading computer: Radical X13
- The best charting platform: TradingView
Pros and Cons of Trading a Descending Triangle
Pros | Cons |
|---|---|
Easy to identify. | The pattern is rarely perfect. |
It can provide insight into the direction of the market. | False breakouts can occur. |
Simple to understand, easy to execute. | Less suitable for long-term investors. |
Profit targets can be calculated. |
How Reliable Is a Descending Triangle Pattern?
A descending triangle pattern, like its ascending peer, is meant to provide insight into the potential future movements of a security, not an exact prediction of the next price.
The same charting pattern used one day can produce completely different subsequent price movements compared to using the pattern on another day.
Descending triangle patterns, therefore, offer insight into the likely direction of a stock, not an exact prediction.
The pattern will typically suggest a bearish signal, with a stock’s price expected to continue to lower, on average, over time. However, as you’ll see below, a reversal can occur, indicating the stock is expected to move higher instead.
Most traders would likely combine information gleaned from a descending triangle pattern with other analysis tools.
A descending triangle bearish pattern built with only two highs and two lows is generally considered less reliable than one with more highs and lows. Typically, more data points are considered more predictive.
Ultimately, each trader decides what confidence they attach to the signal and whether further data (i.e. additional analysis tools) is needed to support a position.
When Is a Descending Triangle Bullish?
Most of the time, a downward triangle formation is considered bearish, but not always.
At times, a bullish descending triangle can form.
Simply, the breakout occurs in the opposite direction.
Imagine a typical descending triangle forms, but instead of the price breaking out below the support line from above, the price breaks out above the resistance line from below. This would imply momentum is likely to continue driving the share price higher.
A bullish descending triangle can also signal profitable setups, though I am less confident in trading bullish descending triangles than bearish descending triangles.
While descending triangles are typically bearish, these bullish triggers are always a possibility. Therefore, it should never be assumed a stock’s price will continue to fall just because a descending triangle has formed. Be sure to wait for a breakout before entering a position, long or short.
The triple bottom chart can look similar to a descending triangle, and is considered a bullish indicator — make sure to understand the difference.
Again, like with bearish breakouts, the height of the thickest part of the triangle can be used to set a price target.
Ascending vs Descending Triangles
An ascending triangle formation occurs when price lows are increasingly higher, but price highs are relatively consistent. As a result, an upward-sloping line can be drawn across the lows, while a horizontal line can be drawn across the peaks.
This contrasts with descending triangle formations that occur when price lows are consistent, with price highs increasingly lower.
Both charting patterns can reveal potential future price directions.
Critically, when discussing ascending vs descending triangles, remember that either can provide bullish or bearish signals.
Personally, I prefer to trade the continuation patterns (bullish for ascending triangles, bearish for descending triangles). In my opinion, trading the continuations (not the reversals) results in higher success rates and larger profit potential.
Final Word: Descending Triangle Chart Pattern
Identifying a downward triangle formation can help traders make more informed decisions by providing signals about future price movements. Like all other technical analysis tools, however, a descending triangle pattern is susceptible to false signals.
Like its ascending triangle counterpart, a stock’s descending triangle formation is best used in combination with other tools. As formations emerge, other analyses can be incorporated to help support or reject a potential scenario.
It’s also important to remember that while the pattern is typically considered bearish, descending triangle bullish signals can emerge. While a stock may trend lower over time, a breakout may occur from below, crossing over the top resistance line.
FAQs:
Is a descending triangle pattern bullish or bearish?
A descending triangle pattern is considered a bearish formation because it implies a security’s price will continue to trend down over time.
What does descending triangle pattern indicate?
A descending triangle pattern indicates the price of a security is likely to continue to fall. The formation reveals a price that is lowering over time and assumes this momentum will persist in the short term.
How accurate is a descending triangle pattern?
A descending triangle pattern generates an accurate bearish breakout 54% of the time. In other words, 54% of the time, a calculated target price will be reached following a breakout.
How do you trade descending triangles?
You trade descending triangles by identifying their formation, calculating a price target, and monitoring for a breakout before entering and ultimately exiting a trade.
Where to Invest $1,000 Right Now?
Did you know that stocks rated as "Buy" by the Top Analysts in WallStreetZen's database beat the S&P500 by 98.4% last year?
Our August report reveals the 3 "Strong Buy" stocks that market-beating analysts predict will outperform over the next year.