Nate is a serial entrepreneur, part-time investor, and founder of WallStreetZen. He holds a Juris Doctor (JD) degree from UAlberta Law - but don’t hold that against him. He’s passionate about building great software that delights users. He occasionally writes about himself in the 3rd person.
We all know we could simply buy an ETF or mutual fund and get the market-average return of about 8% per year.
But investing in stocks like Amazon, Netflix, and Disney before they’re popular can lead to some absolutely massive returns.
I’m talking 10,000%+.
Or, in the case of Monster Energy, even more:
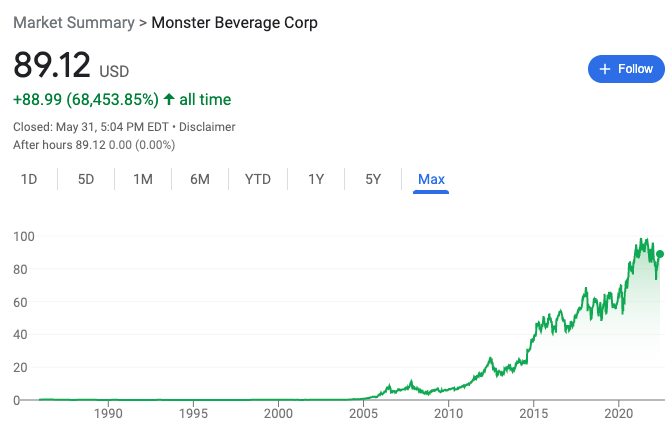
If you had bought $1,000 of $MNST in 2004, it would have been worth $684,538 by the early 2020s.
Sure, this may be an outlier, but the point remains: Get 1 or 2 of these right throughout your investing career and it can be enough to radically improve your lifestyle.
So, the question is, how do you increase your chances of finding the next stock that will wildly outperform the market?
While no one can guarantee that you’ll find the next Tesla, the top stock analysis software on our list does track the performance of stock analysts, so you can follow the new stock picks of the analysts who were recommending Tesla years ago.
Whichever of the best stock analysis software and apps you choose, it should help you generate higher returns by optimizing fundamental analysts’ stock-selecting process or allowing technical analysts to trade smarter.
115 reasons to try WallStreetZen…
WallStreetZen is the top fundamental stock analysis tool in 2026.
Not only does the platform give you access to the fundamentals and analyst sentiment for over 4600 stocks … But it also assigns each stock an easy-to-understand letter grade.
The proprietary Zen Ratings system distills 115 factors proven to drive consistent growth in stocks into an easy-to-read letter score. Stocks with an “A” rating have historically delivered 32.52% annual returns.
The Best Stock Analysis Software & Apps For Fundamentals
1. WallStreetZen

So what is the best stock analysis software for fundamental investors?
WallStreetZen is (in our biased opinion) the best stock analysis software for fundamental investors in .
WallStreetZen was built for the serious, part-time investor.
This stock analysis software aggregates the latest financial data and performs deep fundamental analysis automatically, so you can know the fundamental strengths and weaknesses of any stock in minutes. It also provides simple, one-line explanations so you know the exact methods going into its calculations.
As mentioned above, WallStreetZen tracks the performance of stock analysts from institutions all over the world who have consistently proven their ability to pick huge winners (more on this below).
If you’re looking to perform fundamental analysis, generate new stock ideas, screen companies based on the criteria you find most important, or get stock picks from top analysts, WallStreetZen is the best stock program for you.
Zen Ratings
Zen Ratings is our proprietary system that distills 115 factors proven to drive consistent growth in stocks into an easy-to-read letter score. Plus, to dive in deeper, you also get individual grades for the key components that go into the score. (Fun fact: Zen Ratings is a key part of the evaluation process that 40+ year market veteran Steve Reitmeister uses to select stocks for the market-beating Zen Investor portfolio.)
Let me walk you through an example. Let’s take a look at a current stock that has a B rating — Wix.com (NASDAQ: WIX). Side note: WIX also happens to be a recent Stock of the Week selection from our Zen Investor Editor in Chief, Steve Reitmeister. Here’s what its Zen Rating looks like:

Buy sounds good, but what goes into that rating? On the same page, you can also see how WIX fares on the seven components (each made up of several individual checks, adding up to over 115 factors total) that play into the score. Now, you have a better idea of where the stock really shines — as well as any potential areas of concern.

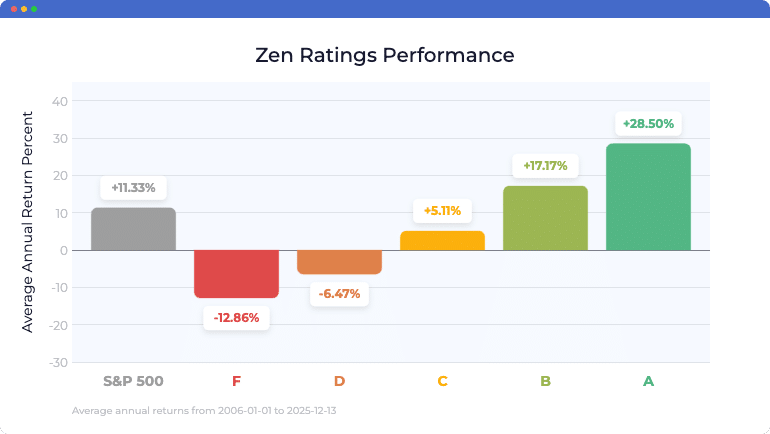
As a B rated stock, WIX is in the 20% of stocks based on the Zen Ratings system, which have generated an average return of 17.17% returns per year. Here’s where it gets even better: A-rated stocks using the Zen Ratings system have generated an average annual return of 28.50% since 2006. At any time, hundreds of stocks have an A or B rating, giving you plenty of high-potential stocks to choose from.
You can also dig deeper through the Forecast page to cross-reference what analysts are saying about the stock:

There’s a lot to like about this stock — I may buy a few shares myself! (If you don’t already have a brokerage account, check out our list of the best stock trading apps). But before I do, I’ll be sure to double check the Zen Ratings page again to see if anything changes.
Top Analysts
Top Analysts is a list of nearly 4,000 analysts from around the world. Beyond just sourcing their research reports, WallStreetZen ranks each analyst based on their returns, consistency, and win rate over multiple years, so you know exactly which analysts to take advice from.
For example, Philippe Houchois (a Top 4% Analyst) started recommending TSLA in December 2018 at a split-adjusted price of about $73 per share. From there, it ran to a high of more than $1,200 in less than 12 months, a gain of more than 1,544%:
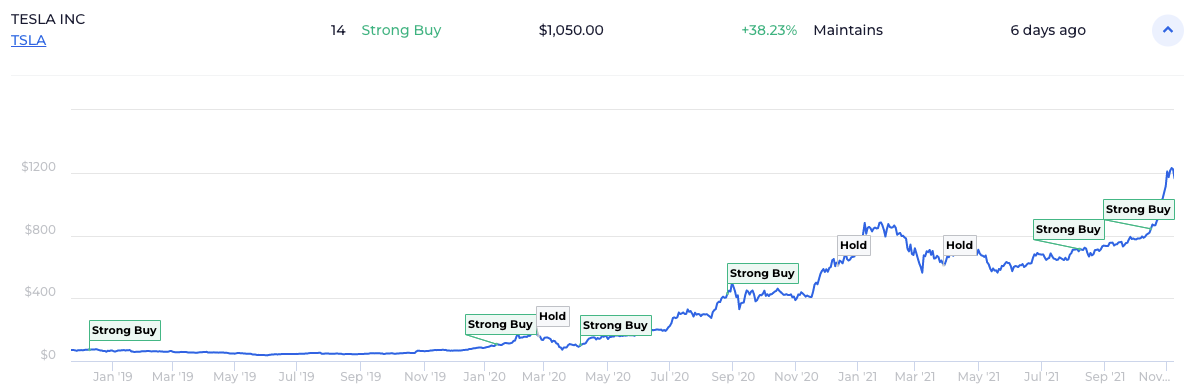
Houchois now rates TSLA a hold, but there are other like-minded stocks that he rates a Strong Buy, like Rivian (NASDAQ: RIVN).
Plus, “Find out why” gives you access to the exact reasons why an analyst made their buy/sell/hold recommendation:
Michael Baker, a Top 2% Analyst, has had some huge winners in the retail sector:
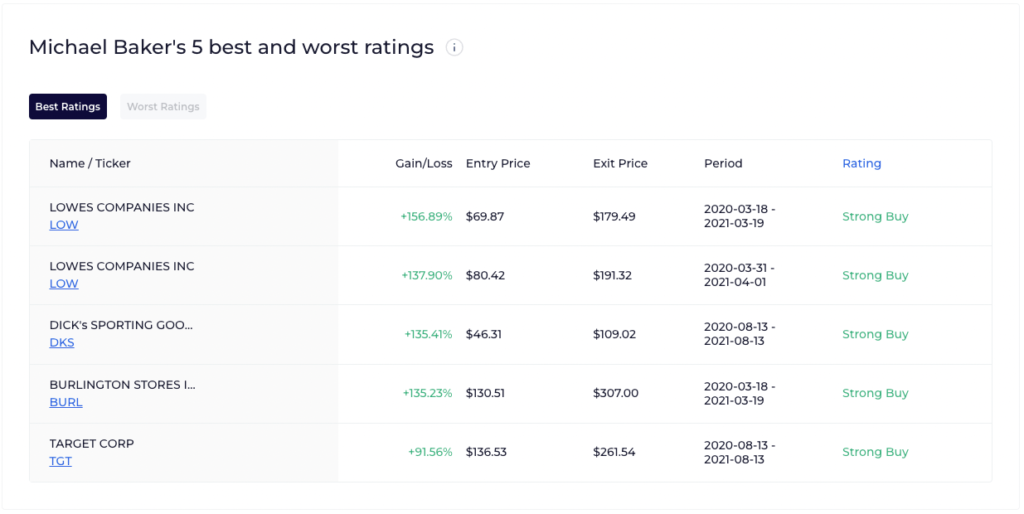
Looks like he just maintained a Strong Buy rating on Best Buy (BBY), suggesting 32%+ upside.
And he’s not the only analyst who likes this stock:
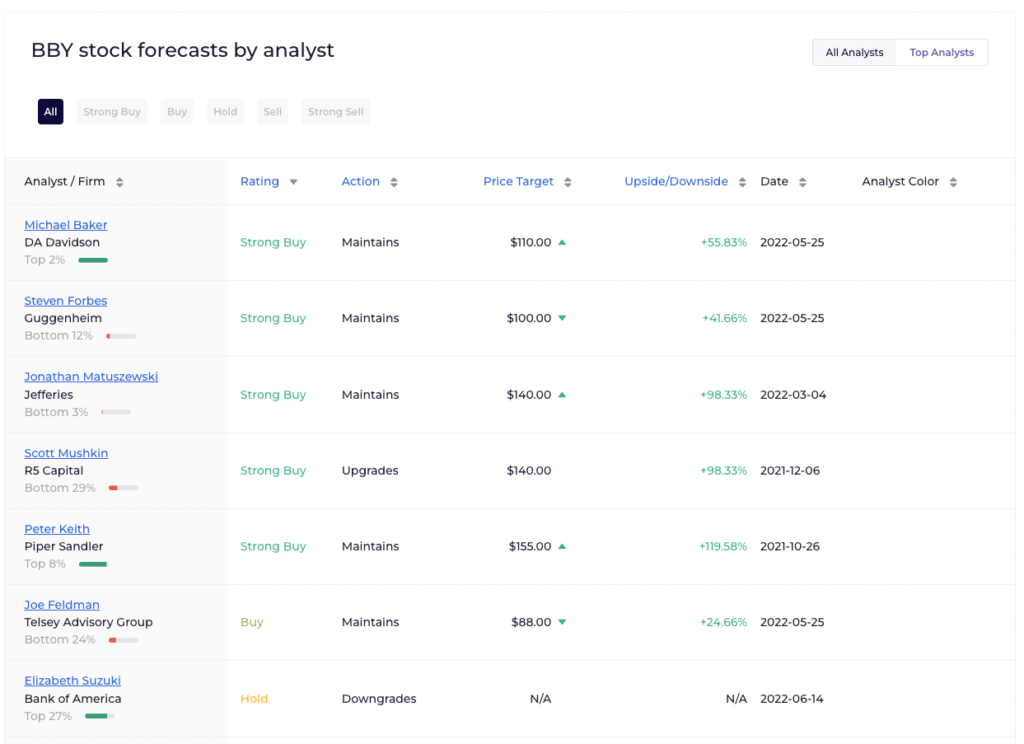
You may want to add that one to your Watchlist for further review.
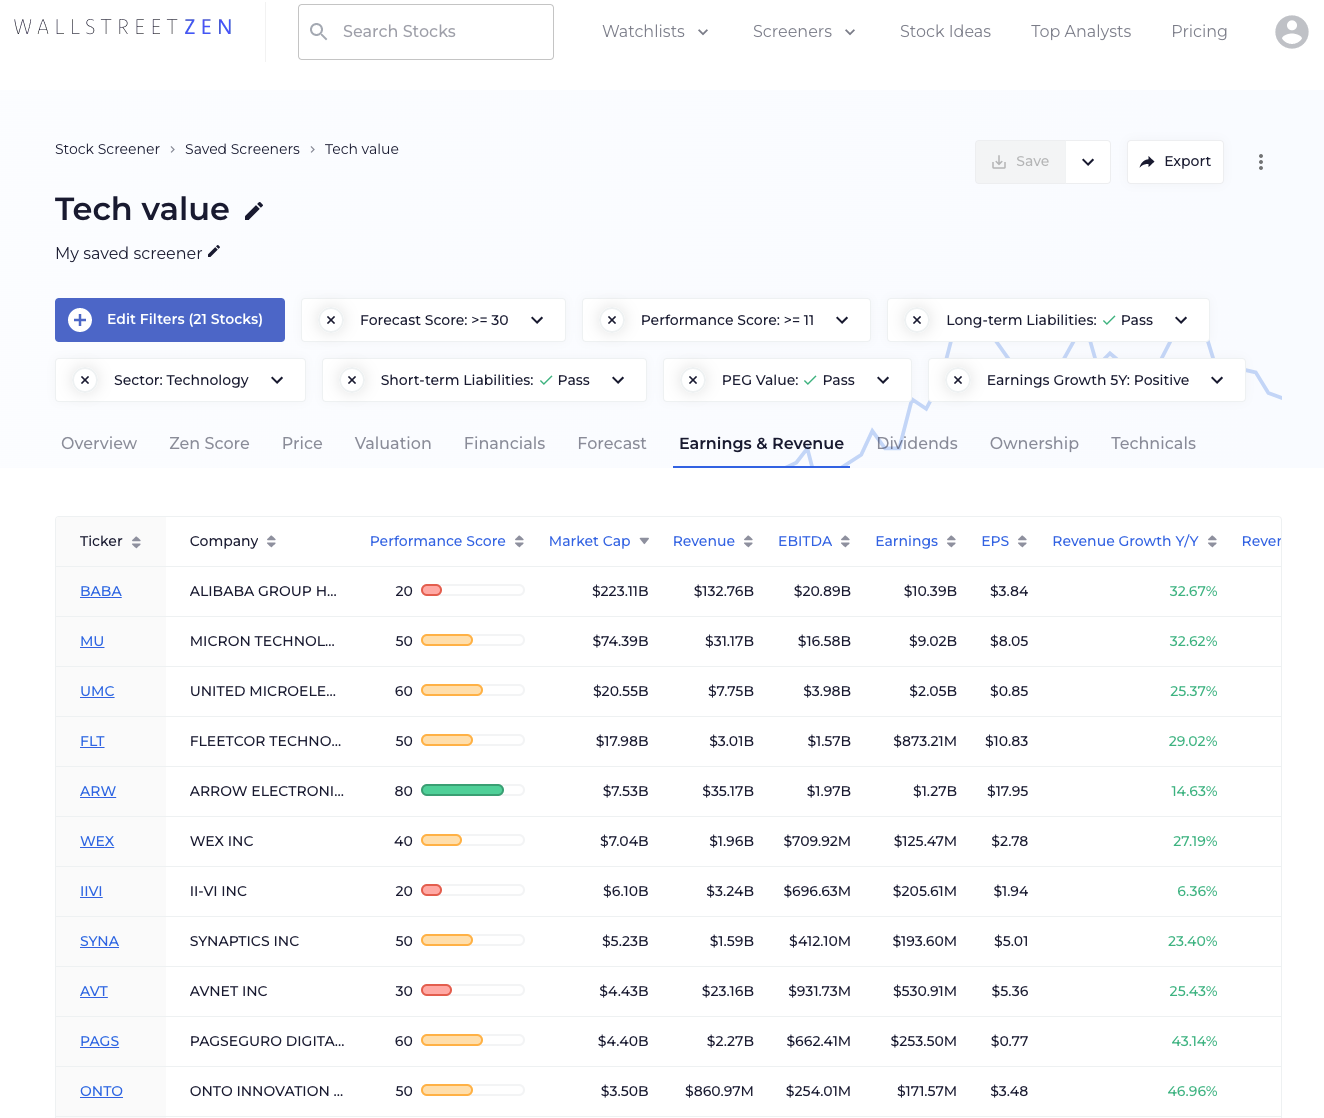
Stock Screener
FINVIZ works pretty well, but with all those quantitative measures, it can make it hard to turn my personal preferences into investment ideas.
WallStreetZen fixes this problem by having both quantitative and qualitative criteria in its Stock Screener, plus you can save your setups:
A library of pre-built Stock Ideas can help you get started if you don’t want to come up with your own set of criteria.
And More…
I mentioned Watchlists and “Why Price Moved”, but don’t forget about news feeds, visual comparisons across time, consensus ratings, and so much more:
Plus, unlike the other sites you’ll find on this list of stock software, WallStreetZen offers the vast majority of its features for free, up to a certain number of uses per month, plus a 14-day trial of Premium.
Who It’s For
If you’re a fundamental investor, WallStreetZen is the best software for stock analysis because it has the tools to handle your entire investing process:
- Fundamental analysis ✅
- Technical analysis ❌
- Investment research ✅
- Stock pickers/analysts ✅
- Stock screener ✅
- News and quote data ✅
The Top Analysts, Stock Screener, Zen Ratings, and the other complementary features make this the best stock analysis software in 2022 for fundamental investors.
WallStreetZen wasn’t made for day traders, but it’s never a bad idea for a trader to check the underlying fundamentals of the stocks they’re trading or know how analysts are rating them.
Pricing
WallStreetZen has two plans: Basic and Premium:
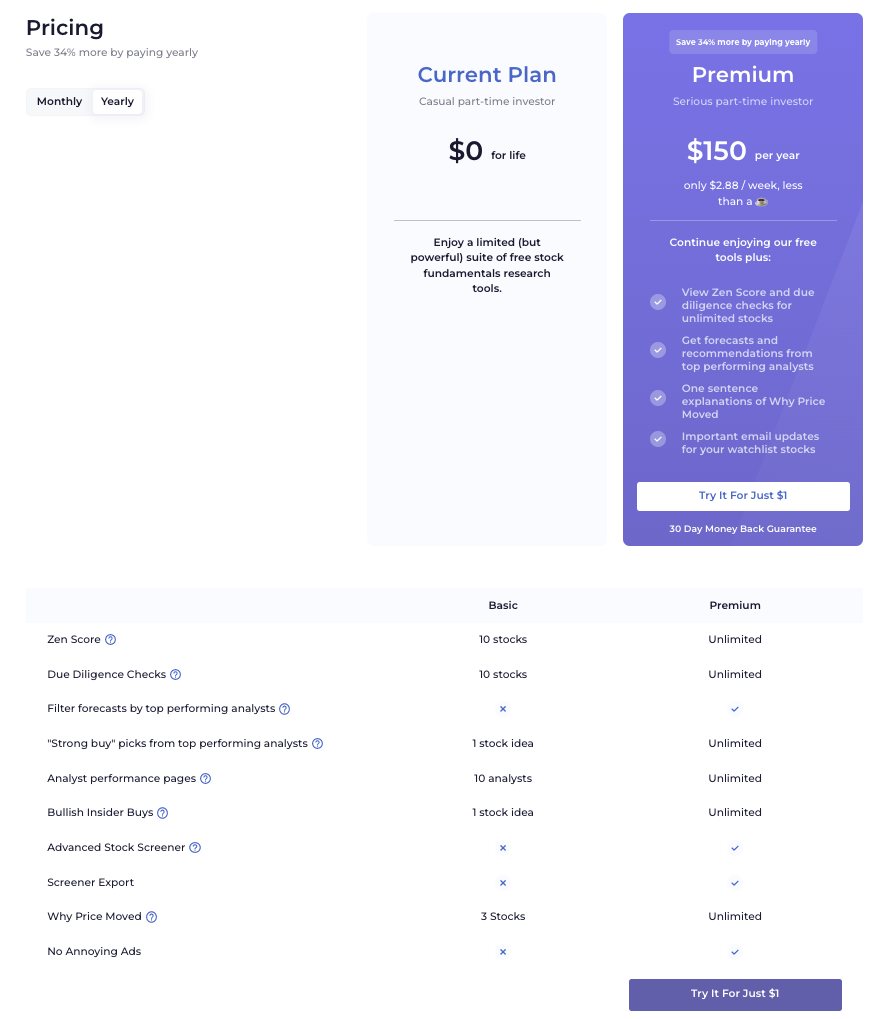
Unlike the other software & apps on this list, the Basic plan comes with almost every feature, but power users will want to upgrade to Premium to unlock unlimited access, which is just $12.50/month (billed annually).
To further solidify its spot as the best stock software, after your trial period ends, Premium also comes with a 30-day, money-back guarantee.
2. Seeking Alpha
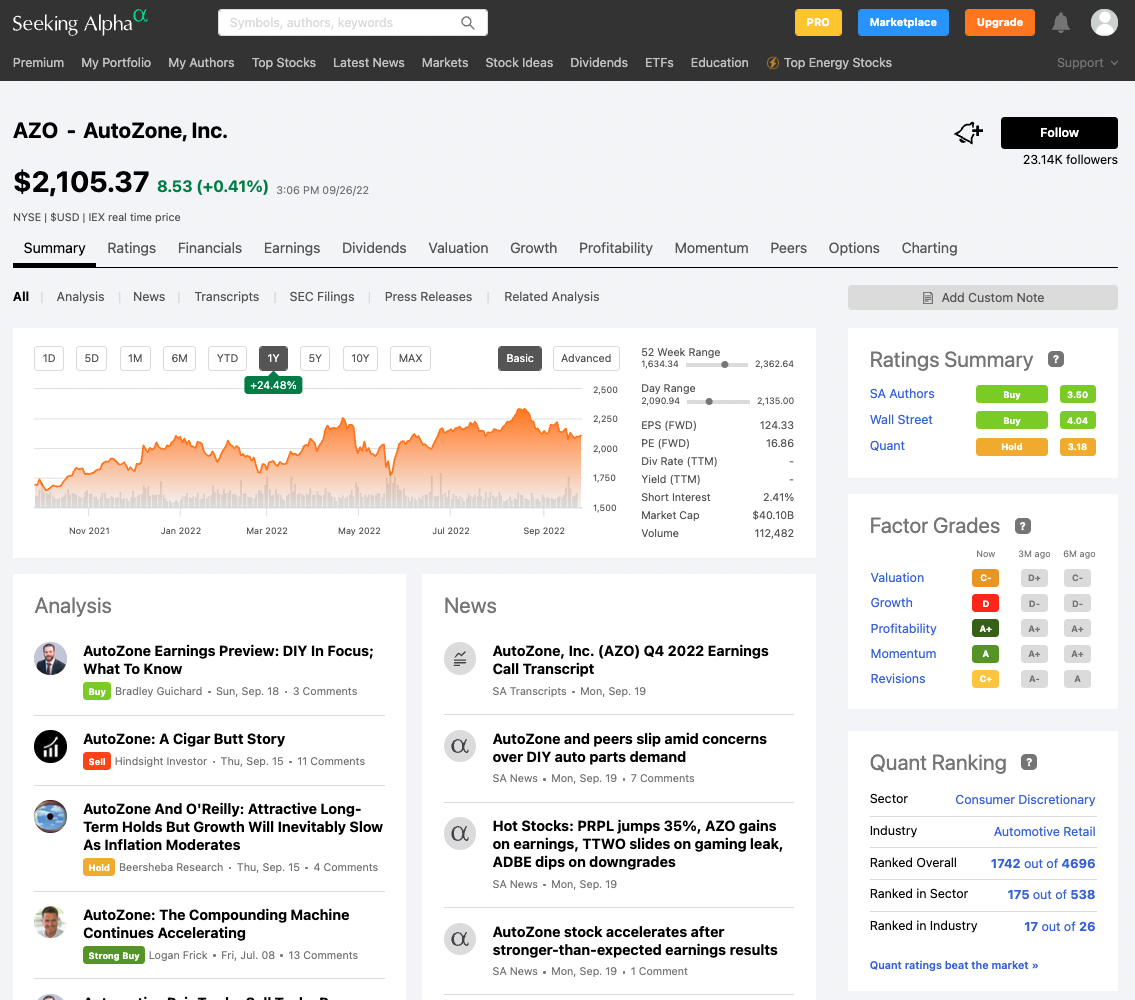
While WallStreetZen is largely built around you performing your own fundamental analysis on which you make your own decisions (including research performed by top analysts), Seeking Alpha has a different approach, putting its analysts front and center:
These articles and blogs (which are typically buy/sell/hold recommendations) about stocks and market trends are crowdsourced by investors with varying backgrounds, some amateurs and some professionals. Technically, anyone can apply to be a writer on SA, though only the best get traction on the site and there’s a strict editing/approval process.
Users are encouraged to follow their favorite authors and get notifications on all their new alerts. Then, users will typically buy and sell those authors recommendations, based on their research and reports.
To help you with your own investing decisions, Seeking Alpha’s authors pitch you ideas to evaluate and either buy, sell, or hold.
While it does offer data for fundamental and financial analysis, like income statements, balance sheets, and statements of cash flow, this information serves as a backdrop to its analysts’ research, and – like its screener – is reserved for Premium users only.
However, unlike other stock recommendation apps, these analysts are incentivized to present a clear and solid case for each of their buy/sell decisions, adding a layer of transparency into their own portfolios that you won’t find anywhere else. Plus, if they don’t publish quality work and their ideas don’t come to fruition, they will inevitably lose their following.
While it isn’t made for technical investors, many analysts include basic charts in their recommendations with trendlines and entry/exit points.
Who It’s For
If you’re looking for some new stock ideas from a wide variety of amateur and professional analysts, Seeking Alpha Premium could be a great option for you:
- Fundamental analysis ❌
- Technical analysis ❌
- Investment research ✅
- Stock pickers/analysts ✅
- Stock screener ✅
- News and quote data ✅
Seeking Alpha is for investors who want to read and replicate others’ portfolios and ideas, not for those looking to perform their own fundamental analysis to make their decisions.
Pricing
Seeking Alpha has 3 membership tiers, Basic, Premium (the best value, in my opinion), and Pro:
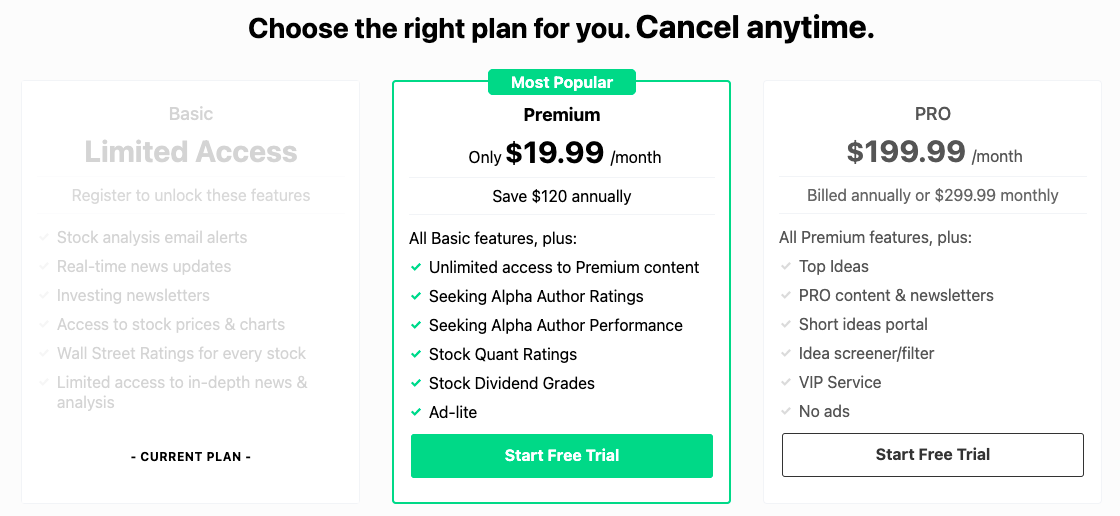
Premium comes out to $19.99/month (when billed annually) after a free trial.
3. Stock Market Guides
History doesn’t repeat, but it rhymes. Stock Market Guides takes advantage of this fact with carefully backtesting that predicts how a stock might perform in similar setups in the future.
As a subscriber, you can benefit from these proprietary algorithms in a variety of ways.
First up: Stock Market Guides’ scanners. You can scan based on chart patterns, stock indicators, or fundamentals to find trade setups that have a backtested edge.
Stock Market Guides offers both free and paid versions of their scanners, with more information available in the latter version — with the free version, you’ll miss some of that backtested data. (Image below.)

With a paid scanner subscription, you gain access to complete trade setups that indicate when to close the trade, including alerts when it’s time to sell:

There are varying plans for the scanners. They have a stock investing scanner for $19 per month, a swing trading scanner for $39 per month, an option scanner for $59 per month, or you can bundle them all for $69/month.
In addition to the scanners, Stock Market Guides also offers backtested alerts. That means they can do the scanning for you and just deliver the buy and sell alerts to your inbox. As a stock investor, you have a few options to choose from:

As for a track record? As of April 2025, Stock Market Guides’ stock alerts boast an average annualized return of 43.1%. As a subscriber myself, I can’t recommend Stock Market Guides enough. (For more, check out our Stock Market Guides review.)
4. Morningstar
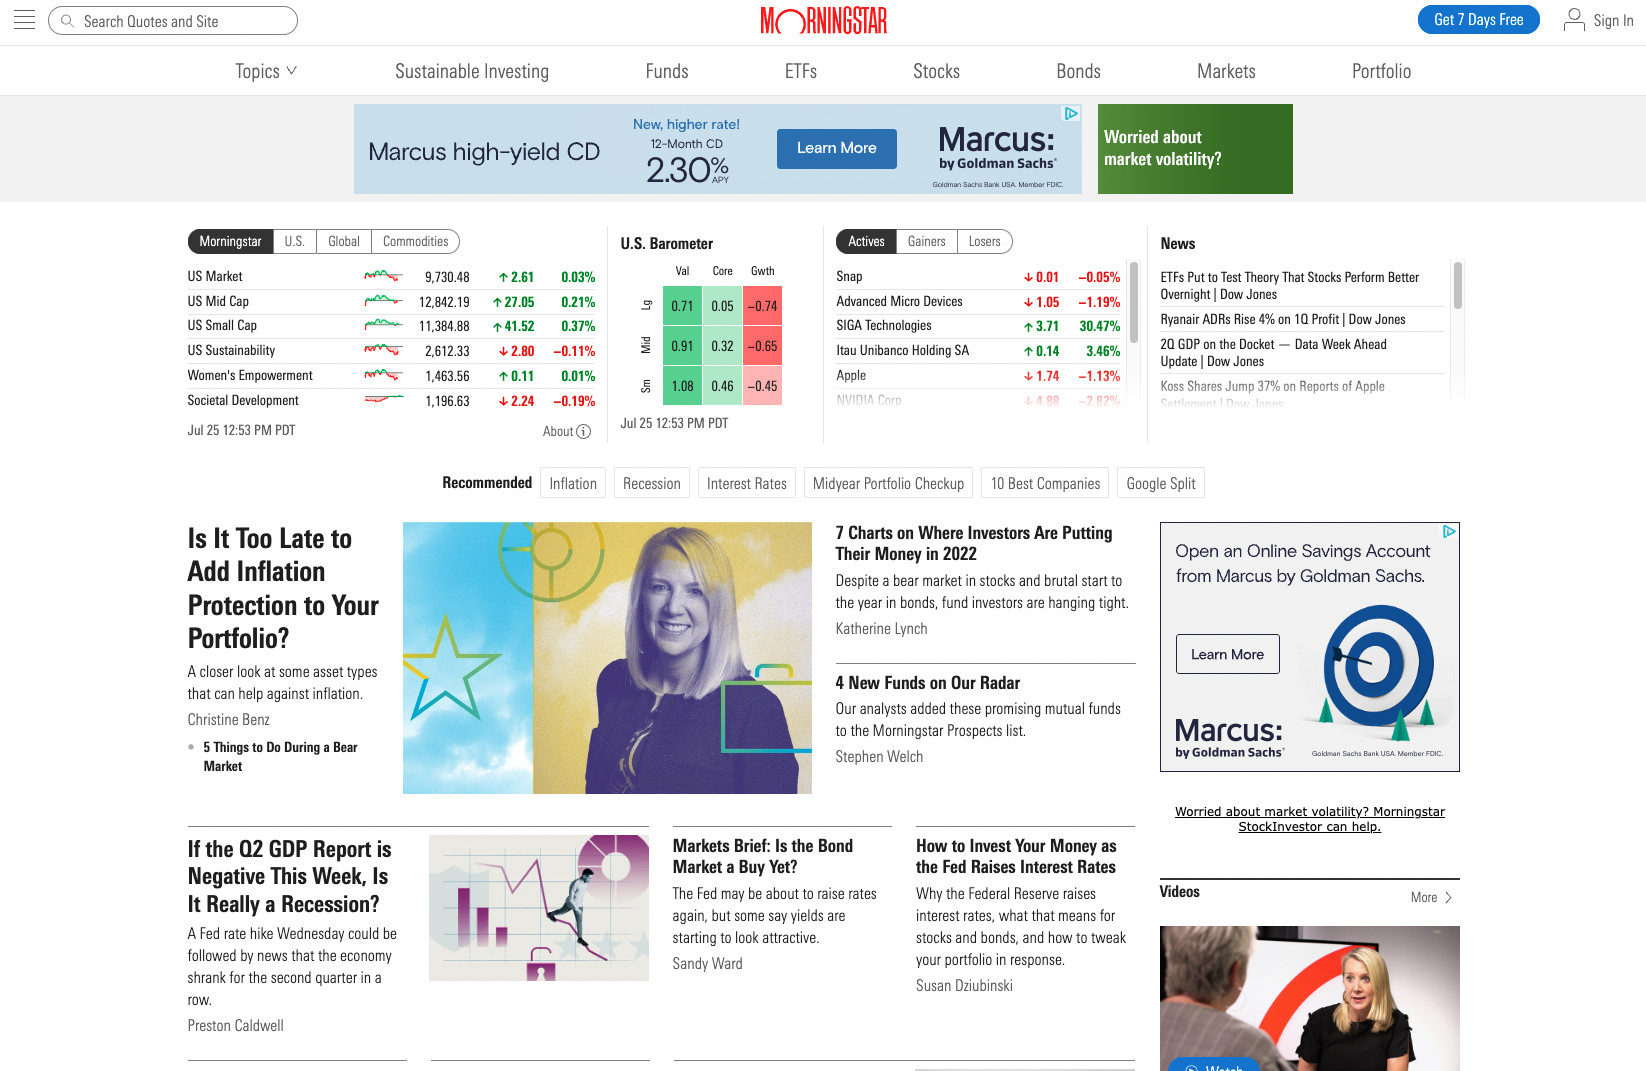
Morningstar is one of the best stock analysis softwares because of its focus on hard data for the long-term value investor and is used by both retail and institutional investors alike.
I’m guessing you’ve seen “Morningstar ratings” on a non-Morningstar website, which should be an indication of the respect Morningstar has earned from its peers.
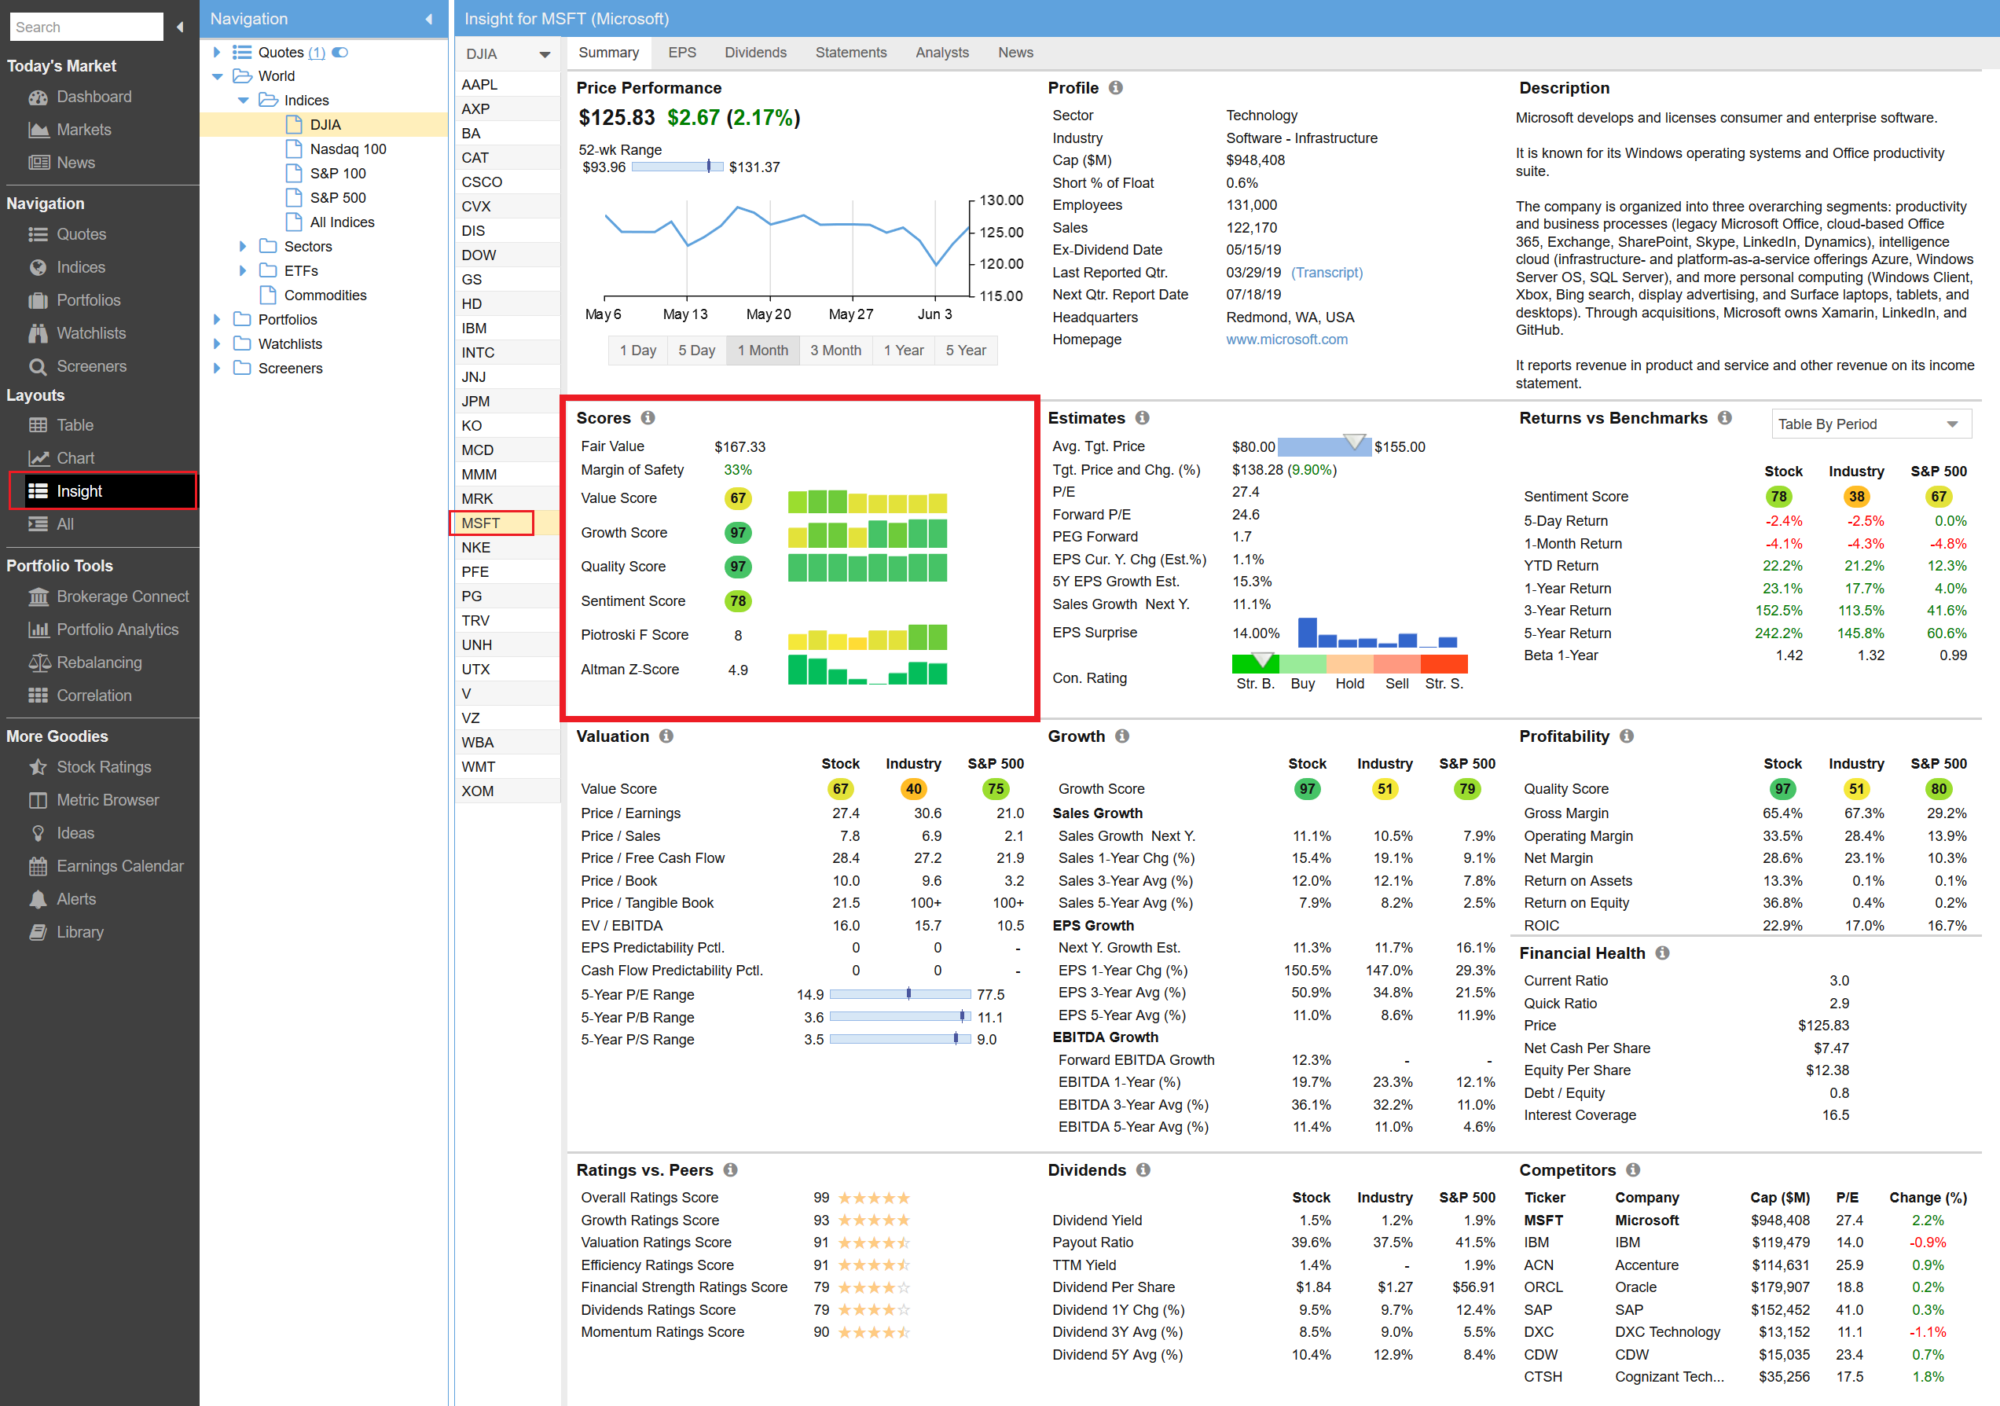
Beyond fairly detailed financial data, there’s plenty of content, analyst reports, daily updates, news feeds, and newsletters:
While Morningstar does allow you to research stocks’ fundamentals, its primary focus is mutual funds and ETFs.
The company provides an abundance of well-researched, independently sourced data, which gives its users confidence knowing how much due diligence has gone into each data point on its site.
Morningstar Investor has tools for tax planning, asset allocation, personal finance, retirement, and education investing.
It’s an excellent option for fundamental investors and should find its way onto every best stock software list.
Who It’s For
Morningstar Investor is a fantastic tool for long-term, fundamental investors (especially those oriented towards mutual funds and ETFs) who want to stay on top of the latest market news:
- Fundamental analysis ✅
- Technical analysis ❌
- Investment research ✅
- Stock pickers/analysts ✅
- Stock screener ✅
- News and quote data ✅
However, given the sheer volume of information, the site can be a bit overwhelming, especially for investors spending less than 40 hours/week researching stocks.
Pricing
Like its peers, Morningstar comes in two forms: Basic and Investor (Formerly Premium).
Investor normally costs $249, but we’ve got a special offer for our readers: First, a free day trial — then, if you like it, you can nab Investor for $50 off. Just use the links in this post and the offer will automatically show up.
5. Stock Analysis
Stock Analysis is one of the best stock websites for fundamental investors.
It has coverage on more than 120,000 stocks and funds, including quote-level details, financial statements, statistics, analysts ratings, and more.

It’s like Yahoo Finance, but faster, easier to navigate, and with more free features.
In addition to financial statements, Stock Analysis also shows business metrics — company-specific KPIs that show how a business is really performing. For example, Tesla’s vehicle deliveries, Apple’s iPhone sales, and Nvidia’s data center revenue.
Altogether, its combination of features make it an excellent place for do-it-yourself investors to perform their own stock analysis.
Who It’s For
Stock Analysis is a great all-around tool for long-term, fundamental investors. However, its focus is on providing objective data you can use to form your own opinions, so if you’re looking for done-for-you investment research this isn’t the site for you:
- Fundamental analysis ✅
- Stock screener ✅
- Stock pickers/analysts ✅
- Investment research ❌
- News and quote data ✅
- Technical analysis ✅
Pricing
There is a paid version of Stock Analysis (Pro) which unlocks all of its tools and data, but most users find the free version to be more than sufficient, and that’s why I included it in this list.
6. Stock Rover
Stock Rover is a quality stock analysis software for fundamental investors.
Although it lacks the investment research capabilities of WallStreetZen, Stock Rover does have a more robust suite of portfolio management features. You can connect your investment portfolios, calculate your future dividend income, perform fundamental analysis, access financial statements, and analyst estimates.
The software also includes Research Reports which allow you to access historical data and download specific company information with one mouse click.
Who It’s For
If you’re looking for a solid fundamental analysis software with some portfolio management capabilities, Stock Rover may be worth looking into:
-
- Fundamental analysis ✅
- Technical analysis ✅
- Investment research ✅
- Stock pickers/analysts ❌
- Stock screener ✅
- News and quote data ✅
However, given the sheer volume of information, the site is perhaps best suited to intermediate and seasoned investors — it could be intimidating to newbies.
Pricing
Stock Rover has four paid plans: Premium ($34/month), Premium Plus ($70/month), Ultimate ($99/month), and Ultimate Pro ($199/month). Annual and 2-year billing options are available at up to 40% savings.
7. FINVIZ
FINVIZ is one of the best stock analysis software tools because of its ability to let you quickly find winners and losers and search for new investment ideas based on very specific criteria.
While it does have other features, investors and traders primarily use FINVIZ for its screener:
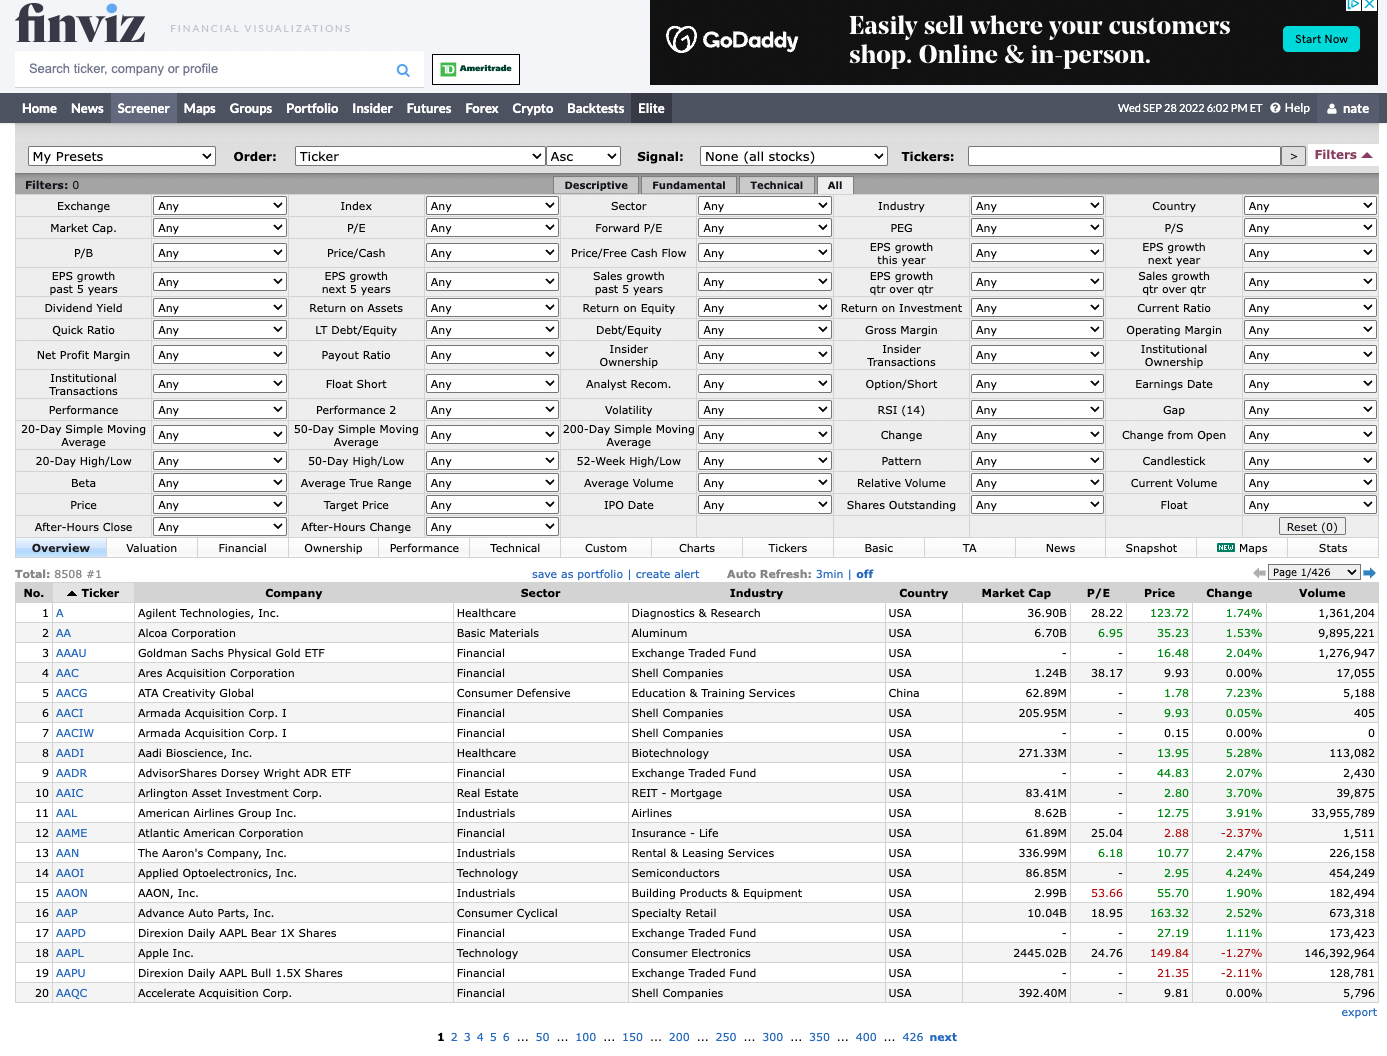
If you make data-driven investments and/or are looking to quickly uncover a variety of ideas that match specific investment criteria, you should give FINVIZ a test drive.
Who It’s For
FINVIZ is a great option for investors who want to quickly uncover a variety of stock ideas based on technical and fundamental data.
- Fundamental analysis ❌
- Technical analysis ✅
- Investment research ❌
- Stock pickers/analysts ❌
- Stock screener ✅
- News and quote data ✅
The software is extremely data driven, however, and can be cumbersome and lack user friendliness if you don’t know exactly what you’re looking for.
Pricing
I recommend using the free version of FINVIZ – no need to upgrade to FINVIZ Elite (unless you’re a power user, which I define in my FINVIZ Elite review).
The Best Stock Analysis Software & Apps For Technical Traders
Most technical analysis software basically have the same set of features.
Assuming you don’t need a specific tool’s proprietary feature, your decision will likely come to personal preference on functionality (ease of use), layout (user interface), and cost.
8. TradingView
TradingView‘s charting software is used daily by traders from all over the world:
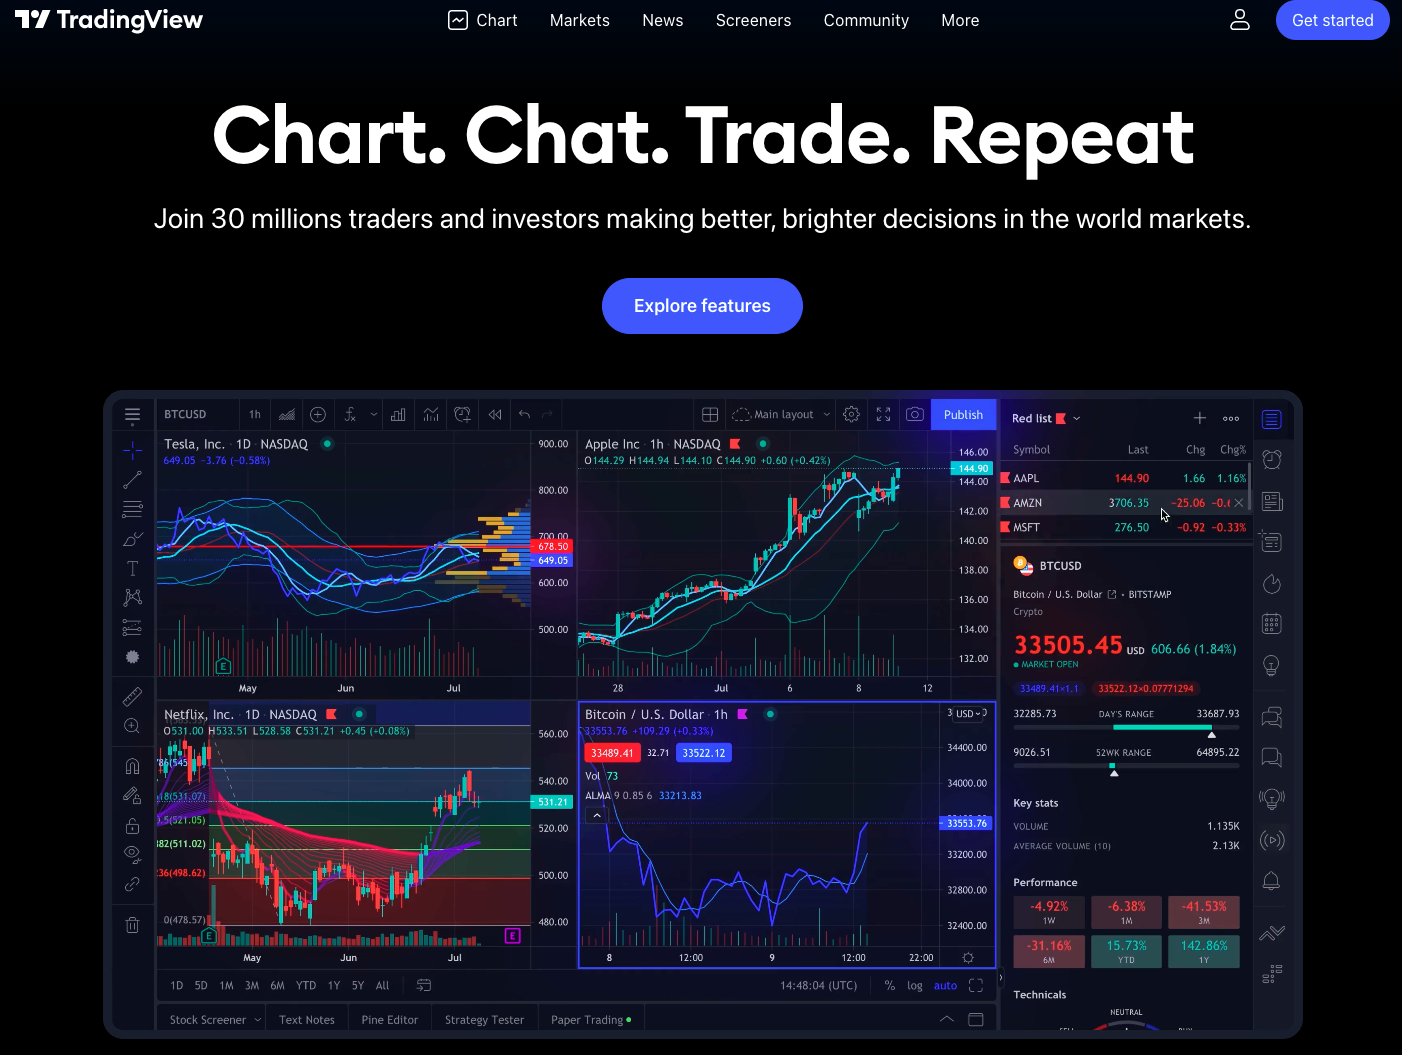
And for good reason.
I’m willing to bet, if you’ve used any sort of charting tool before, you can get on TradingView for the first time and feel comfortable in the entire stock program within 5 minutes.
It’s the best stock analysis software for beginners who are just figuring out how to chart, and it’s also useful for seasoned veterans who want to build their own set of overlay functions.
The interface is intuitive and elegant, but it’s not all show – you’ll love the power of its Watchlists, stock screener, drawing tools, chart replay capabilities, and market overview.
Did I mention the highly customizable charts? You can customize the chart type, alerts, colors, and more. You can also easily save and share charts.
TradingView is the best free trading analysis software.
And it’s completely web-based. Simply login from any browser and start trading.
If you do decide to trade off it full time, you will want to pay for the premium membership – it’s worth it.
I’d recommend starting with the 30-day free trial for Pro+:
Who It’s For
Whether you’re just getting started in day trading or you’re a long-time charter, I would highly suggest giving TradingView a chance:
- Fundamental analysis ❌
- Technical analysis ✅
- Investment research ❌
- Stock pickers/analysts ❌
- Stock screener ✅
- News and quote data ✅
It may be a bit too glitzy for the hard-core, no-nonsense trader.
Pricing
You can upgrade via Monthly or Annual plans to Pro, Pro+, or Premium:
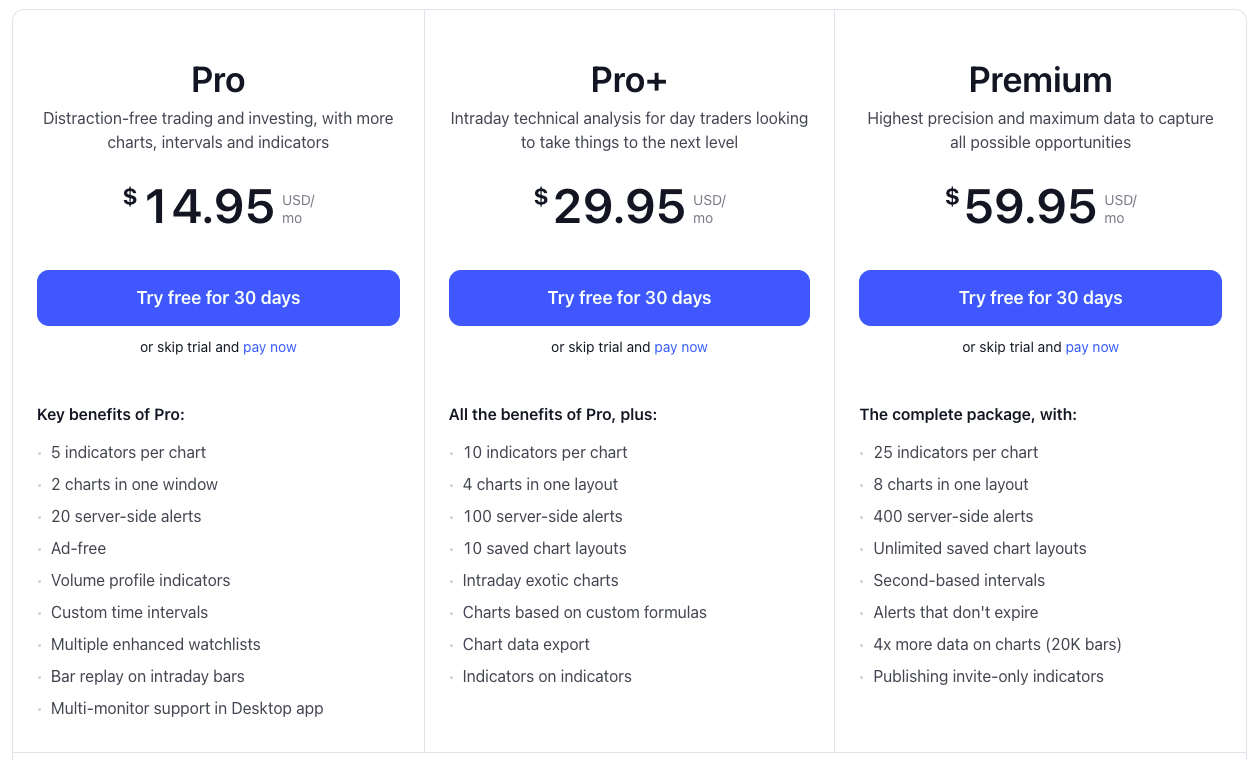
Each level includes a 30-day free trial.
At just $29.95/month, Pro+ is the best value for real traders.
9. thinkorswim
thinkorswim is the best free stock analysis software.
The program’s advanced features have stood the test of time — thinkorswim has remained a premier player in the world of technical analysis and market data since its release in 1999:
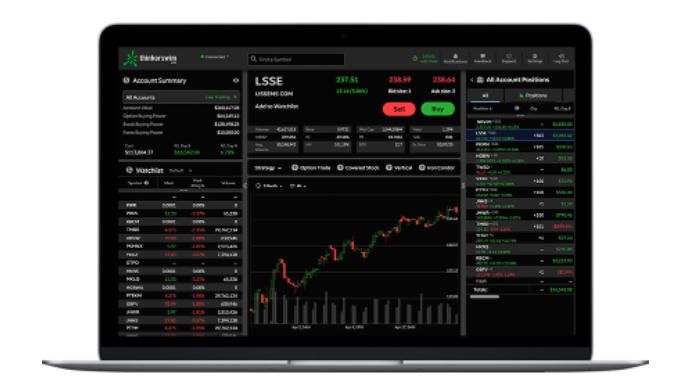
When most investors hear technical analysis, they picture the thinkorswim interface.
You’ll find it all: plenty of drawing tools, technical indicators and studies, data visualizations, third-party fundamental data, options statistics, and real-time market news.
For the coding-oriented trader, thinkorswim also allows traders to create their own analysis tools by using a built-in programming language called thinkScript.
For aspiring day traders, thinkorswim also has a “paperMoney” feature that allows you to practice your trading strategies on real charts without using real money.
Although it’s long been just a desktop stock program, there is also a web-based version and you can take it mobile as its the best stock analysis app.
Plus, it perfectly integrates with Schwab brokerage accounts and trading platform, allowing you to buy and sell from inside the program.
Anybody can download the thinkorswim app or use the web-based version at no cost.
Who It’s For
Thinkorswim is the best choice for investors with Schwab accounts, new traders who want to sharpen their skills (with paperMoney), those interested in real-time options data, price-conscious traders, and those who just prefer its functionality.
- Fundamental analysis ❌
- Stock screener ❌
- Stock pickers/analysts ✅
- Investment research ✅
- News and quote data ✅
- Technical analysis ❌
There’s a lot to like about thinkorswim, but the program can occasionally feel sluggish – not a great attribute in a day trading software.
Pricing
It’s completely free. Download the desktop version here or find the web-based version here.
10. TrendSpider
Like TradingView and thinkorswim, TrendSpider has extensive charting capabilities, indicators, and different advanced chart types for in-depth technical analysis:

This stock program can automatically plot trendlines, identify support and resistance levels, and allows you to set dynamic price alerts – a suite of features perfectly suited for the non-full-time day trader or swing trader.
Its features also include an integrated stock screener, backtesting, dynamic alerts, unusual options flow, insights, and some fundamental data.
TrendSpider works on any browser, and subscribers can also use the iOS and Android mobile apps.
Who It’s For
More active traders and day traders gravitate towards 1 of the first 2 options, while swing traders more frequently tend towards TrendSpider:
- Fundamental analysis ✅
- Technical analysis ✅
- Investment research ❌
- Stock pickers/analysts ❌
- Stock screener ✅
- News and quote data ✅
If you find the layout compelling, there’s no reason not to make TrendSpider your day trading tool of choice.
Read our article on TrendSpider vs TradingView.
Pricing
There are definitely more affordable options for technical analysis software. After a 7-day free trial, users can choose between Premium, Elite, and Advanced:

Elite is the best value, at $87/month or $65/month when billed annually.
The 2 Types of Stock Analysis Software & Apps
Do you label yourself as primarily being a fundamental investor or technical investor?
Sure, you might use both types to inform your investing and stock trading decisions, but most individual investors will lean more one way than the other.
As such, stock analysis programs fall into 2 main categories:
- Fundamental analysis – For long-term, buy-and-hold investors
- Technical analysis – For day traders, buying and selling based on price action and trends
I’ve organized this list of the 6 Best Stock Analysis Software & Apps into those 2 categories, plus a detailed explanation of each sites’ best features and limitations, what type of investor it’s right for, and pricing.
If you’re a 50/50 split fundamental/technical investor or don’t adhere to one single trading system, you may decide to choose one from each group.
Here’s the outline:
- The Best Fundamental Analysis Software & Apps in
- 1. WallStreetZen
- 2. Seeking Alpha
- 3. Morningstar
- 4. Yahoo! Finance
- 5. Stock Rover
- 6. FINVIZ
- The Best Technical Analysis Software & Apps in
- 7. TradingView
- 8. thinkorswim
- 9. TrendSpider
Summary: The Best Stock Analysis Software & Apps for Better Returns ()
To recap, the best stock analysis software for you depends on if you’re a fundamental investor or a technical trader.
For fundamental investors, WallStreetZen is the place for you.
It has it all: Recommendations from top analysts, a customizable screener, top-tier fundamental analysis and investment data, and news feeds to keep you abreast of any new developments.
And don’t forget, even if you’re a pure day trader, you may also want to supplement with a software focused on fundamentals, either to trade on high-quality stocks or to add to your long-term portfolio.
For technical traders, we like TradingView.
Its user-friendly design and functionality coupled with its speed, accuracy, and affordability make it a compelling option for traders with wide ranges of experiences.
Read more: 4 Best Stock News Apps & Sites (Stock Market & Financial News in 2022) or Best Penny Stock Trading Platform
Where to Invest $1,000 Right Now?
Did you know that stocks rated as "Buy" by the Top Analysts in WallStreetZen's database beat the S&P500 by 98.4% last year?
Our June report reveals the 3 "Strong Buy" stocks that market-beating analysts predict will outperform over the next year.