Jessie Moore has been writing professionally for nearly two decades; for the past seven years, she's focused on writing, ghostwriting, and editing in the finance space. She is a Today Show and Publisher's Weekly-featured author who has written or ghostwritten 10+ books on a wide variety of topics, ranging from day trading to unicorns to plant care.
There are a lot of great stock charting platforms out there. What’s the best one for you?
I won’t keep you in suspense…
Best Stock Charting Software in 2026: The Bottom Line
For the majority of investors, TradingView has the goods — it’s by far our top charting software pick thanks to an easy-to-use platform, large variety of chart types, and advanced charting tools that cover a wide range of technical and fundamental indicators and analysis.
But that doesn’t mean it’s the only option, and it doesn’t mean it’s the best one for you. For instance, if you’re looking for an all-in-one tool where you can do deep fundamental research and chart out potential long-term investments, StockRover might be a better pick. If you prefer an easy-to-use app on the go, Webull might be your top pick.
Below, I’ve broken down the key features, strengths, and weaknesses of the 11 best chart platforms. You’ll find options for all sorts of investors and trading styles, from day traders to long-term investors to crypto traders.
Let’s dive in.
At-a-Glance: Best Stock Charting Software in 2026
You’ll find a more comprehensive list below, but here’s a peek at some of our top picks:
⭐ Best overall stock charting software ⭐ | |
Best broker with free charting tools | |
Best all-in-one stock research + charting software | |
Best stock charting software for automation-savvy traders | |
Best stock screener/stock charting software | |
Best for news-driven traders | |
Best visual features | |
Best for mobile-focused traders | |
Best for powerful desktop charting | Interactive Brokers |
Best free stock charting software | thinkorswim |
Best crypto charting software |
11 Best Charting Software Platforms in 2026
Keep reading to find the right stock charting platform for your trading strategy.
1. TradingView – Best Stock Charting Software Overall
- Overall rating: 5/5
- Ease of use: 4.5/5
- Cost: Multiple tiers ranging from free to $49.95/month.
- Promos: Free 30-day trial for all tiers + 16 % off with the link below.
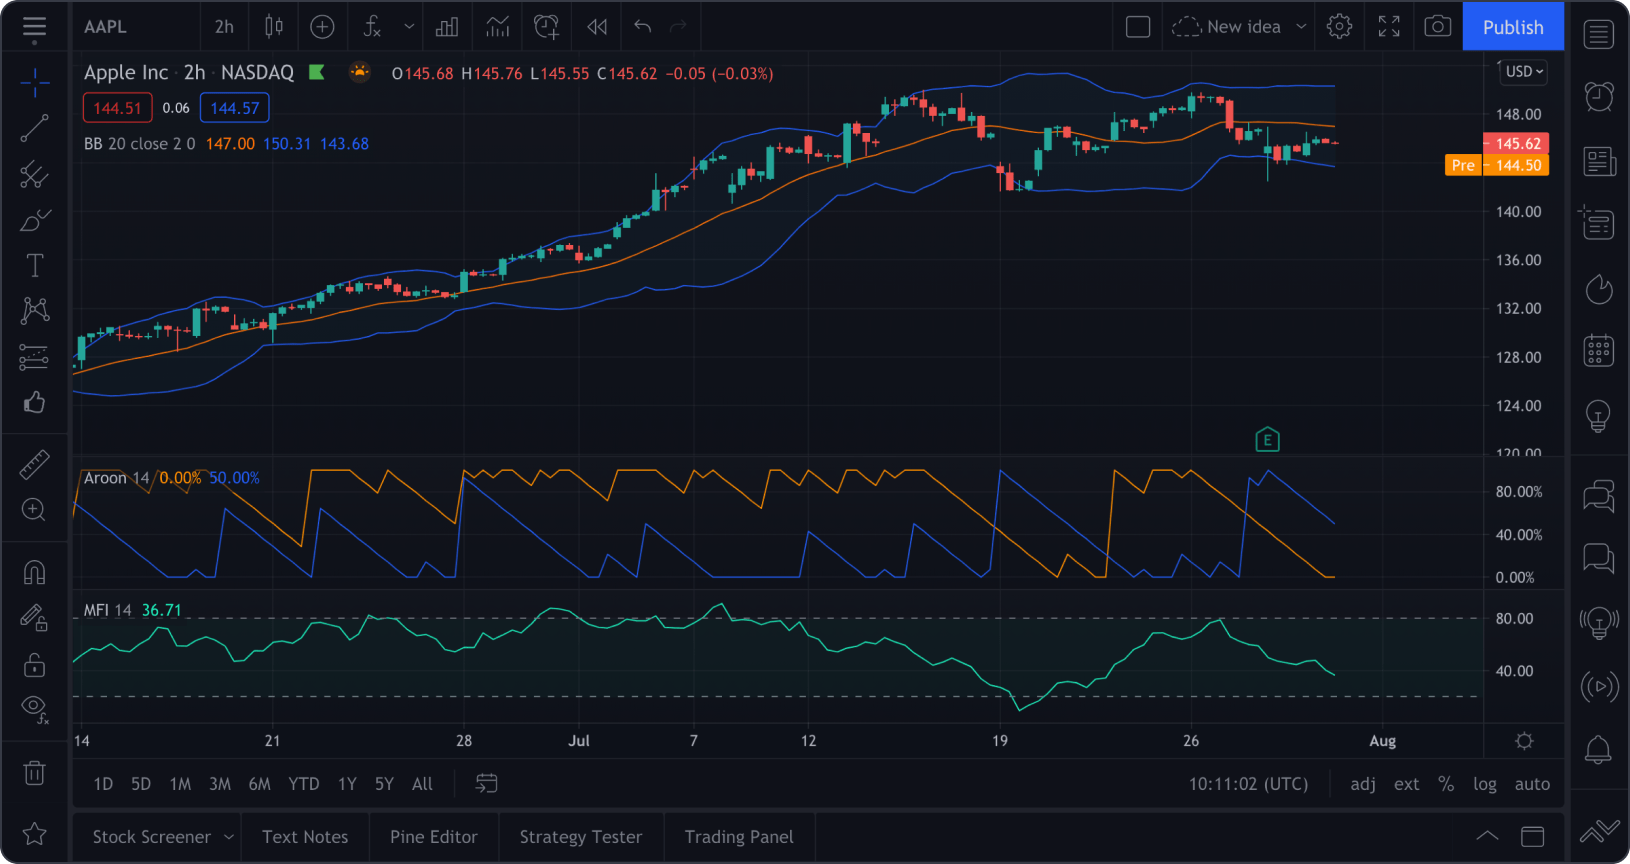
TradingView is a robust platform that’s also hugely popular — it has tens of millions of users across the globe.
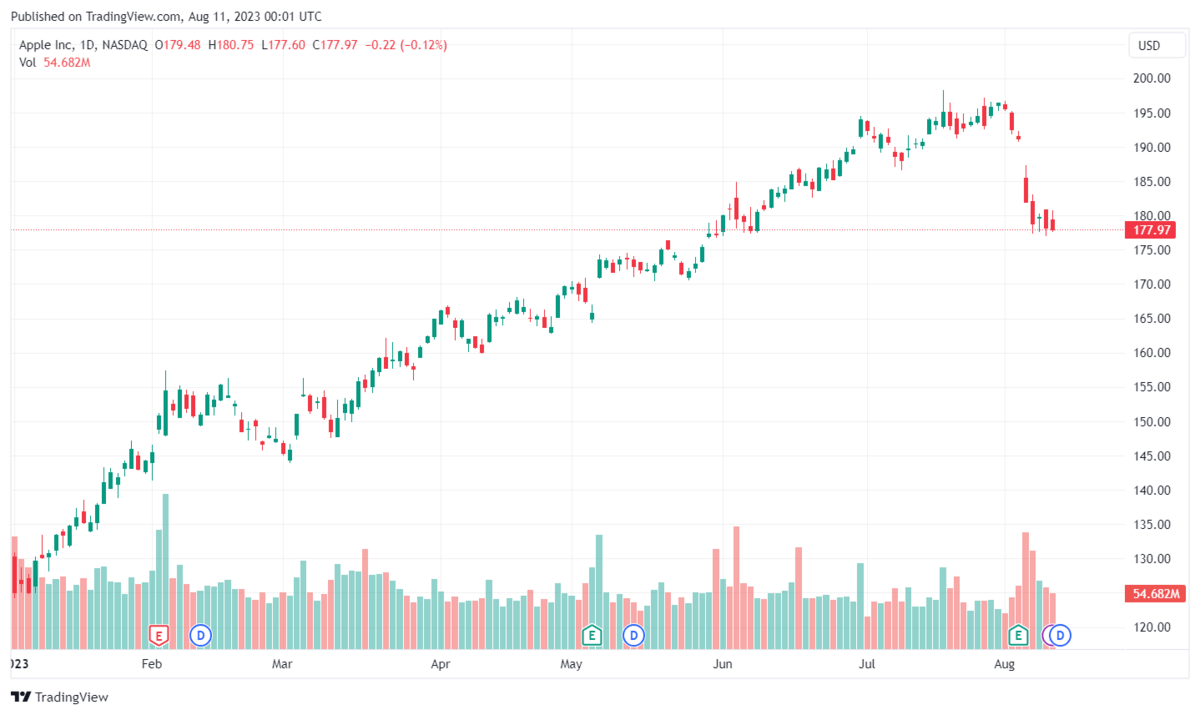
Built with charting in mind, the breadth of tools TradingView offers at every tier, both free and paid, is pretty amazing:
- More than 20 timeframes
- 14 types of charts
- 100+ indicators
- About 100 drawing tools
It also hosts a vast community which, in turn, offers more than 100,000 community-built indicators that give you a high level of customization that can significantly uplevel your trading.
Despite the many tools, it’s easy to use thanks to a clean and intuitive design. It’s also highly customizable so you can focus solely on the features you want.
It’s not a brokerage, but TradingView is integrated with numerous other trading systems, including our top-pick broker for day traders, TradeStation.
In short: TradingView is an excellent choice for beginners, part-timers, and experienced active traders.
While you can access TradingView for free, it has several premium tiers that unlock additional tools. I think that Plus, which costs $24.95 a month, provides the best value as it enables you to simultaneously use 10 chart indicators, view 4 charts in each tab, and unlocks some additional customization. (To review what’s included with each of the tiers, click here.)
Want more info? Read our in-depth TradingView review.
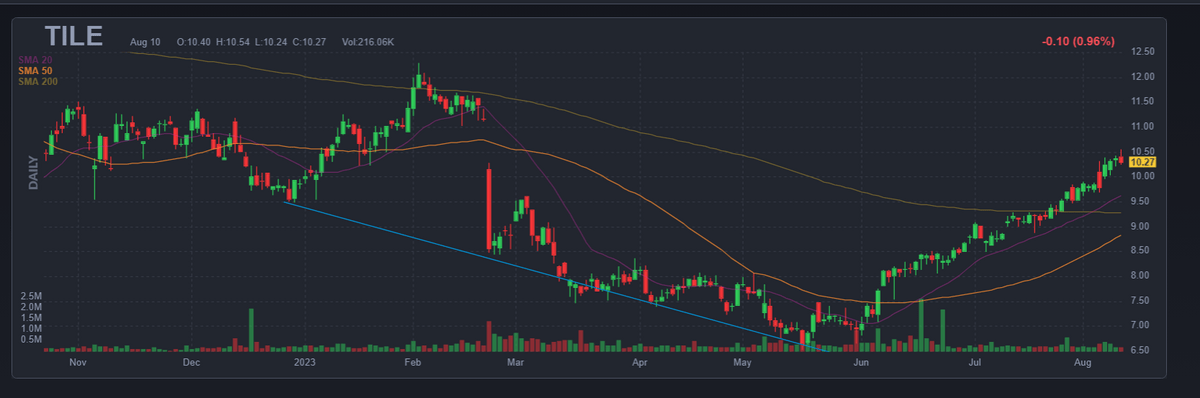
2. TradeStation – Best Broker With Free Charting Tools
- Overall rating: 5/5
- Ease of use: 4/5
- Cost: Free with no commission on trades up to 10,000 shares.
I mentioned earlier that TradeStation can be integrated with TradingView.
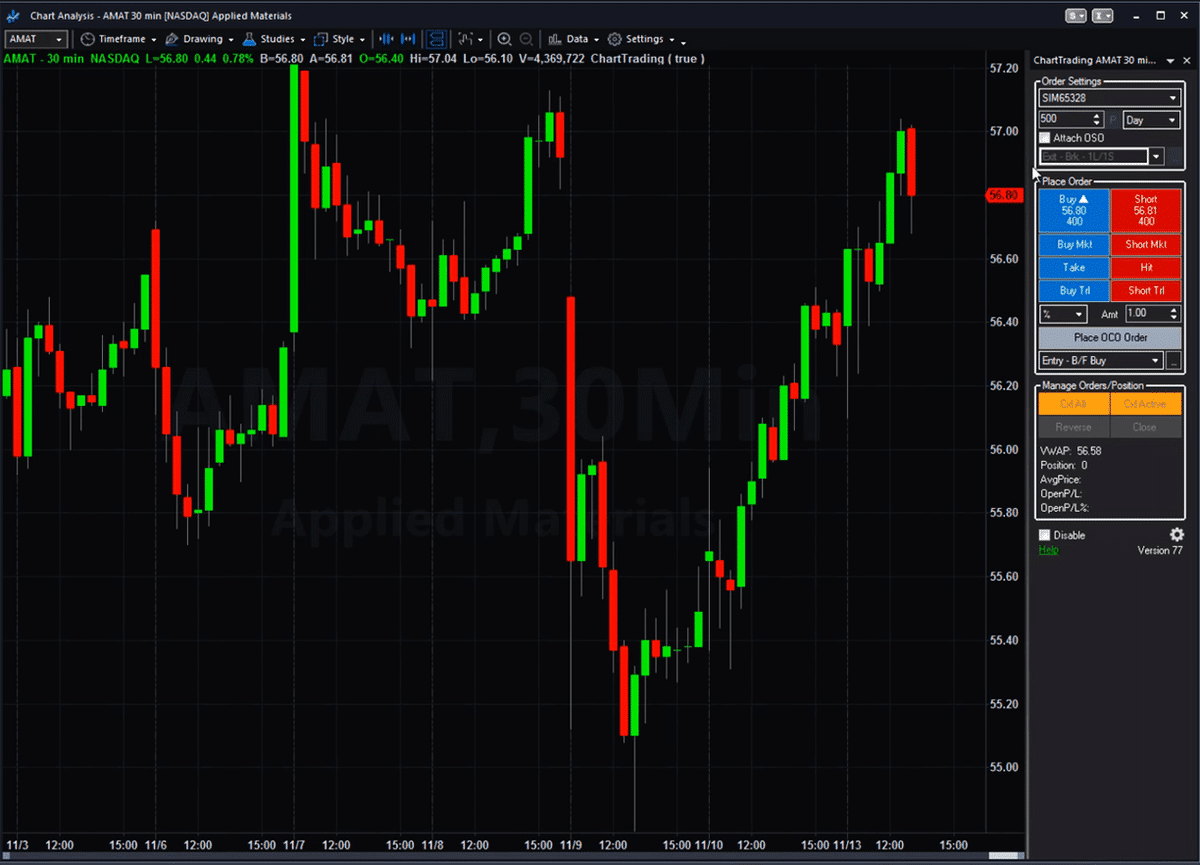
But it also features its own charts with several important custom tools that may be of particular interest to day traders or those interested in technical analysis and historical market data. The platform’s desktop software also boasts many years of historical data, going back around 4 decades that can be combined with almost 300 indicators and chart studies.
TradeStation also offers a mobile app. While not as powerful as the desktop version, it features 44 optional indicators, and its charting capability is dynamic and even provides after-hours visibility.
I actually mildly prefer the mobile version due to its drawing tools which support touchscreen styluses.
TradeStation’s standout chart features include:
- RadarScreen: A stock screener equipped with 329 criteria and alerts.
- Chart Analysis: A window where you can perform technical analysis, customize and optimize automation, show positions and orders, and check price data.
- Matrix: A multi-purpose window that boasts an order-entry tool and gives you insight into market depth, as well as buy and sell signals.
In addition to being a powerful charting tool in its own right, TradeStation is a great broker, particularly for day traders.
With its fast execution times, no commissions and fees for orders up to 10,000 shares and $0.005 per share for larger orders.
Considering its low fees and low barrier to entry, TradeStation is well worth considering for both charts and actually executing trades.
3. StockRover – Best for Portfolio Tracking and Assessing
- Overall rating: 4.5/5
- Ease of use: 4/5
- Cost: $7.99-$27.99/month
If you need a chart for tracking the performance of your portfolio(s), StockRover is a great pick. StockRover offers several subscription plans. Its most extensive offering, the Premium Plus plan, provides more than 650 tracking metrics.
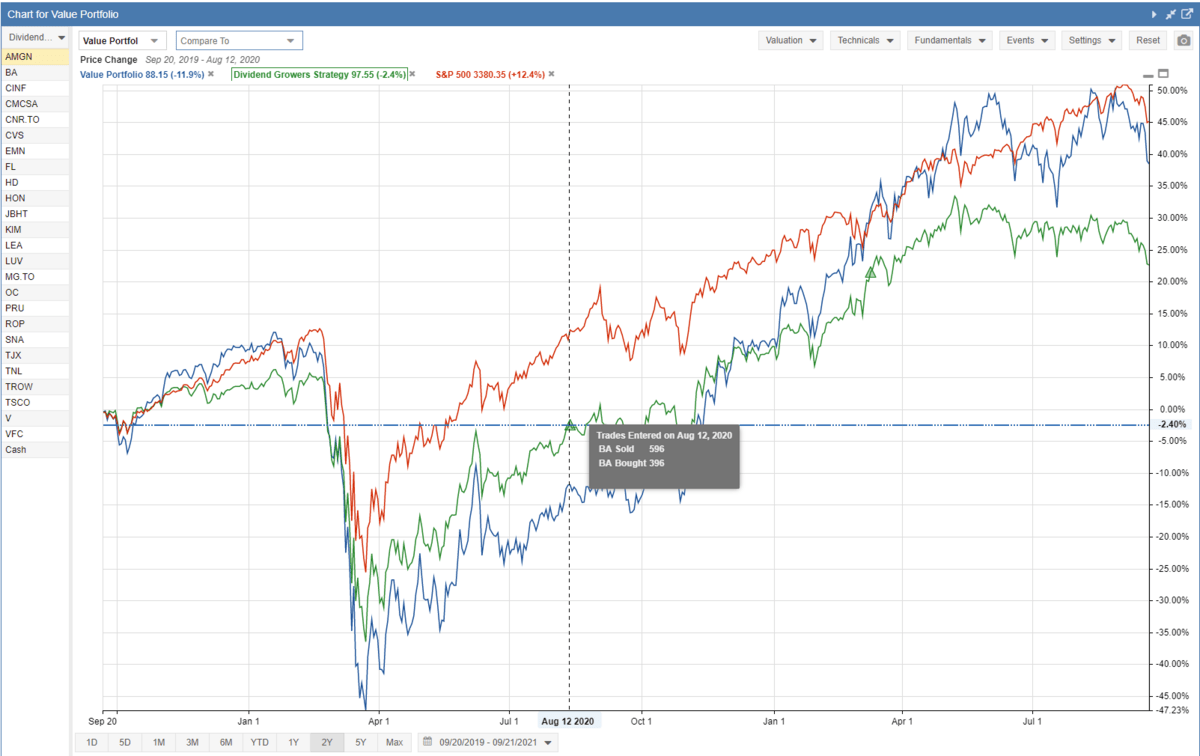
StockRover makes it easy to keep track of how your portfolio is doing through a wide selection of modifications including making customized price charts and comparative performance between several portfolios as well as between your portfolio and benchmarks like the S&P 500.
StockRover also equips you with portfolio rebalancing support, analytics for various positions, price alerts, and automated reports. It also easily integrates with more than 100 brokers making sure that you won’t get a headache setting it up.
All in all, StockRover is a very powerful tool that can help you get an edge with its numerous portfolio-assessing tools whether you are a long-term investor or an active trader.
Additionally, it is relatively cheap. The Essential plan only sets you back $7.99/month; the Premium Plus plan is $27.99. The plans are also discounted if you make an annual subscription with the latter coming in at just over $23/month.
4. TrendSpider – Best Stock Charting Software for Automation
- Overall rating: 4.5/5
- Ease of use: 3/5
- Cost: Free 7-day trial with premium tiers costing between $32 and $179/month.
TrendSpider is primarily built for those of you who like to automate your trading strategies through the use of Smart Charts. Its stock charting software is no exception. It enables you to automate many of the most tedious aspects of technical analysis.
It also boasts an AI assistance tool that truly shines whenever you are using the backtesting function. This meshes really well with the platform’s automated trendlines as it can flag the ones that achieved the greatest success in testing.
TrendSpider helps reduce your workload in other ways. For instance, its software is equipped to recognize around 40 candlestick chart patterns and features dynamic price alerts that you can add whenever building chart patterns.
While TrendSpider has numerous unique and highly useful functions, it’s a niche software in many ways. There is a significant learning curve and the platform itself is singularly useful only if you are a swing trader or very keen on automation.
TrendSpiders offers a free 7-day trial and has several tiers of subscriptions ranging from $32 to $179 per month. Pricing varies; you can choose to pay annually or monthly and the Elite tier, which offers the best balance of features and cost, is $65 with the former, and $79 with the latter option.
5. Finviz – Best Stock Screener
- Overall rating: 4.5/5
- Ease of use: 4/5
- Cost: Offers a free version, and the Elite plan for $39.50/month
If you’ve been trading for a while, Finviz charts might give you a profound feeling of nostalgia. The platform started operating in 2007 and has hardly changed its visuals since.
I’d personally say that this is because Finviz has been focusing on the important stuff rather than getting a facelift. While you might feel that the charts look dated, the software itself is powerful and very versatile.
Finviz’s stock charts are clean, clear, and customizable. It truly shines when it comes to stock screening — in that arena, it may be the best stock charting tool available. Here’s why…
It gives you access to nearly 70 fundamental, technical, and descriptive filters enabling you to always find the right assets for your strategy. These filters, and combinations of filters can also be saved for future use by any registered user.
Beyond chart capabilities, the platform also enables you to compare and assess multiple stocks with tools including heatmaps, fundamental and technical indicators, and more.
Finviz’s charting software is available for free, but premium tiers expand its offerings. The Elite level ($39.50 per month or $24.96 with an annual commitment) gives you access to all of its hallmark features and real-time quotes, its intraday charts and other, more advanced charts, and many other tools.
6. Benzinga Pro – Best for News-Driven Traders
- Overall rating: 4/5
- Ease of use: 4.5/5
- Cost: Limited free tier with premium plans ranging from $37 to $197/month. (Get started with a risk-free trial here)
Benzinga’s charts, while providing most of the features you’d expect from charting software, also boast some rather unique tools. These are, as you’d expect based on Benzinga’s reputation, based around integrating news and fundamental data into its system.
Not familiar with Benzinga Pro? Check out our detailed Benzinga Pro review.
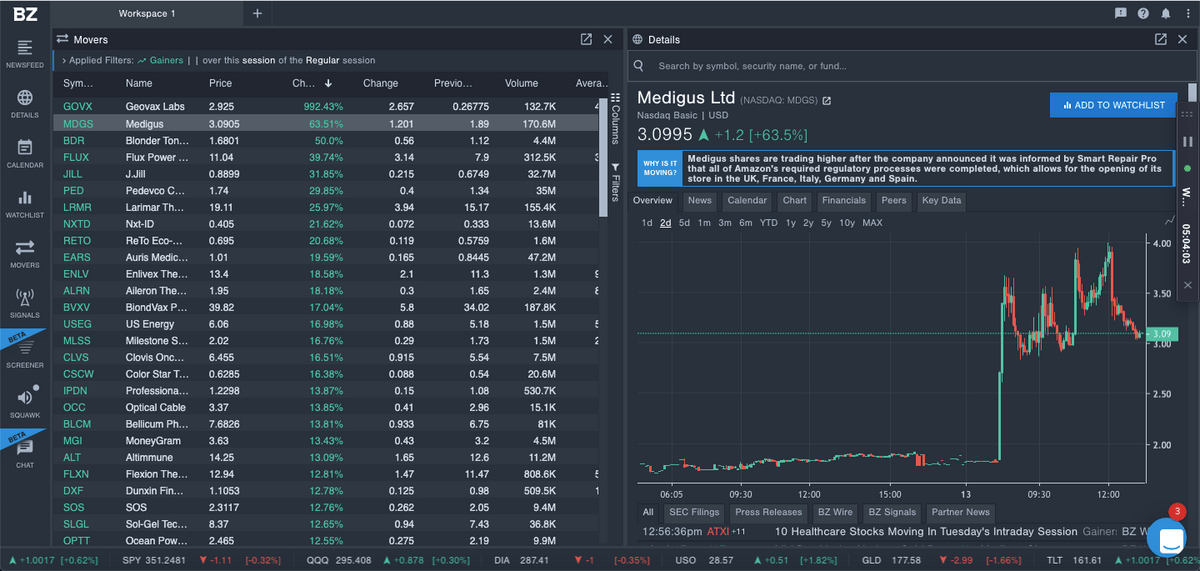
Benzinga’s charts, while providing most of the features you’d expect from charting software, also boast some rather unique analytical tools.
The most notable of these is Benzinga Pro’s newswire with more than 50 pieces published each day and the Squawk feature which gives audio alerts on breaking market news.
Benzinga Pro also provides alerts on tradeable market developments, including:
- Sudden price movements
- Unusual options activity
- Circuit breaker halts
- Gap between yesterday’s close and today’s open
And more.
Circling back to Benzinga Pro’s charting offering more specifically, in addition to its own dynamic charts, you can also integrate it with TradingView. This means you can leverage the powerful native newswire offering with one of the best charting tools available.
Benzinga Pro has three different subscription tiers. There’s also a free offering. The lowest paid tier, the Basic Plan, and the free version are, however, severely limited by a 15-minute delay to data update.
The Essential plan makes Benzinga Pro a much better fit for active traders as it removes the delay and is essential if your main trading strategy is trading on the news it unlocks Squawk and BZ signals. The annual price of the plan is $166/month, and if you subscribe monthly it comes in at $197. But you can score a free, risk-free trial using the link below.
7. Bookmap – Best for Order Flow Traders
- Overall rating: 4.5/5
- Ease of use: 3/5
- Cost: Very limited free tier with premium plans going from $16-$79/month.
Bookmap is a rather unique platform. It was built with active traders in mind, and most of its features are geared toward giving order flow traders a distinct edge.
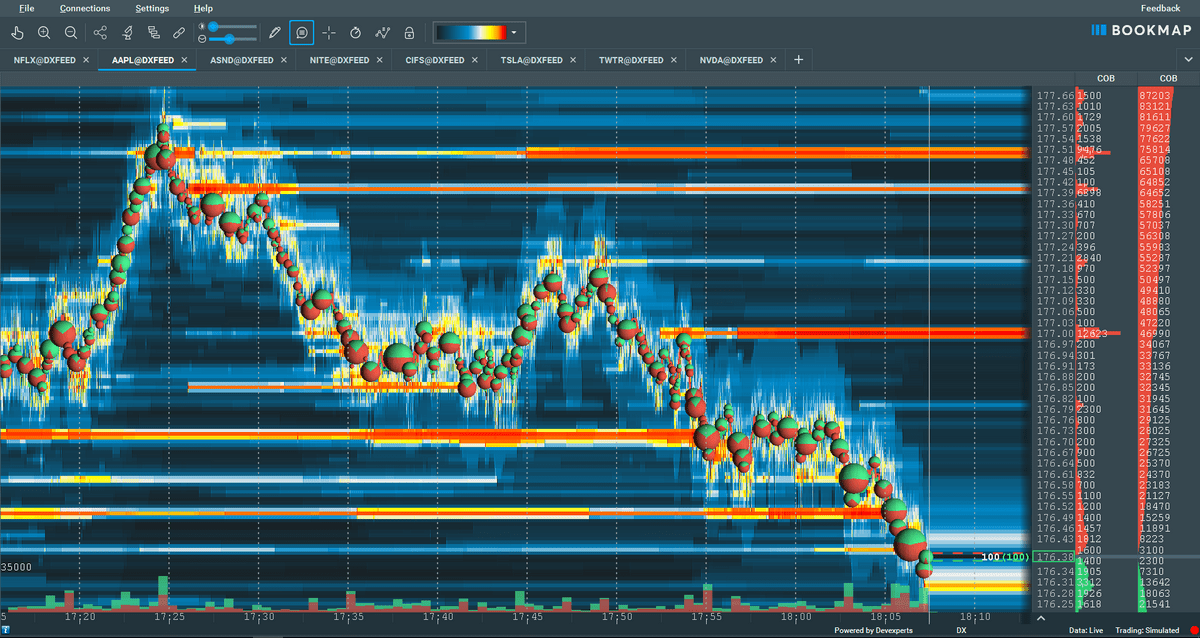
The first thing that comes to mind when I think about Bookmap is its outstanding approach to financial data visualization. Its charting capabilities include several features you’d be hard-pressed to find anywhere else, such as:
- 40 frames per second: Bookmap’s data gets refreshed 40 times each second giving you an almost instantaneous view of the market. Additionally, whenever you are analyzing the data, you can zoom into timeframes smaller than a second, giving you VERY precise information.
- Volume Bubbles: The platform visualizes volume data in the form of bubbles on the chart. The larger the bubble higher the volume. Similarly, the bubble’s color indicates the kind of pressure – green for buying, red for selling. The color-coding of information to boost readability is a hallmark of Bookamp.
- Heatmaps: Bookmap’s heatmaps help you visualize the liquidity of an asset at different price levels with darker shades indicating higher levels, and brighter lower levels.
In addition to these features, Bookmap also offers most of the tools you’d expect from charting software.
If you have a premium subscription, this platform can also help you level up your paper trading as it offers a Record/Replay function. This enables you to run as many simulations as you want on actual past market action.
All of that being said, there are drawbacks to Bookmap.
First, it can be very visually noisy making it hard to read at first. Second, there isn’t much for you on the platform if you are a longer-term investor.
Finally, Bookmap is pricey. While some of its features are available at the free tier, you really need to get a premium subscription if you really want to take advantage of what the platform is offering. Additionally, the quality of the package is directly correlated with the price, and the most expensive tier ($99 per month) is the best one.
Curious about Bookmap? Check out our comprehensive Bookmap review.
8. Webull – Best Mobile-Focused Charting Software
- Overall rating: 4/5
- Ease of use: 4.5/5
- Cost: Free
Webull is a rather different beast than many others on this list. It is available on all mobile devices and is, indeed, designed for use on a smartphone. I think it’s the best platform for mobile, with 12 charting tools and more than 50 technical indicators.
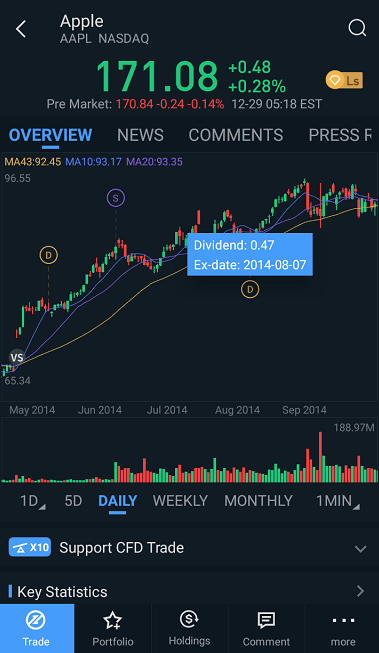
Additionally, Webull is a commission-free online broker and the app itself is also free. When you sign up, you also get access to NASDAQ TotalView Level 2 Advance quotes for three months.
If you want to retain access to that information after the trial period, the subscription is affordable — just $1.99 per month.
9. Interactive Brokers – Most Powerful and Reliable Desktop Charting Software
- Overall rating: 4/5
- Ease of use: 4/5
- Cost: IBKR Lite is free, IBKR Pro charges minor commissions but offers lower margin rates.
Interactive Brokers is, as the name implies, an online platform that offers extensive access to global markets, zero commission trades, and powerful analysis tools with robust charting capabilities.
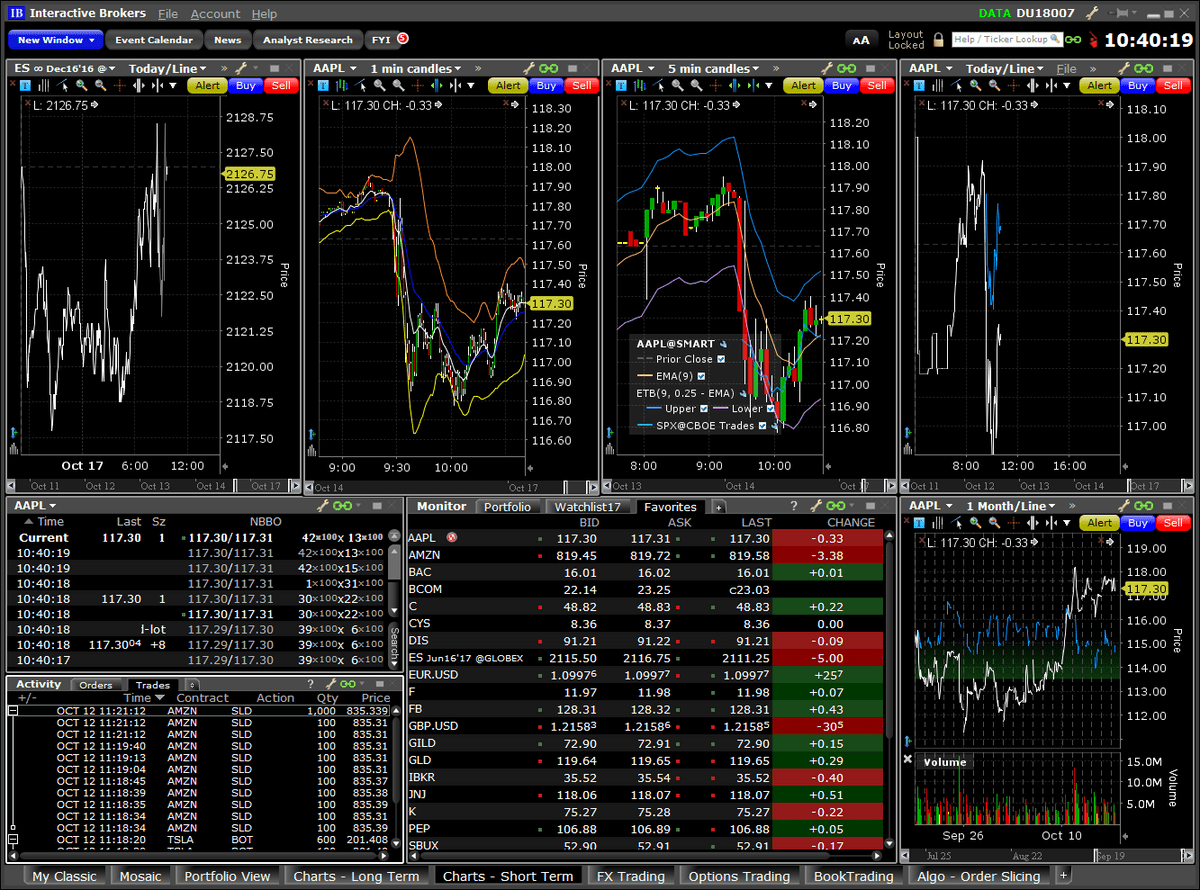
It’s perhaps best known for its desktop platform; its Trader Workstation is a workhorse for many investors. It offers more than 120 technical indicators, plus hotkey integration, so you can both find great trading opportunities and execute them with lightning speed.
Another great thing about Interactive Brokers is that it has integrated TradingView meaning you can switch up your charting software while retaining IBKR’s global reach.
It is noteworthy that while Interactive Brokers is pretty famous for its powerful and reliable desktop platform, its mobile offering is slightly worse as it can sometimes be annoyingly buggy.
Overall, Interactive Brokers’ high degree of customizability, high reliability on desktop, and the ability to trade stocks directly from its charts make it a great choice for day traders.
10. Thinkorswim – Best Free Technical Analysis Charting Software
- Overall rating: 4.5/5
- Ease of use: 3/5
- Cost: Free
Thinkorswim is a feature-packed and powerful charting platform, formerly offered by TD Ameritrade, now offered through Charles Schwab. It has a long history compared to many of the other platforms as it dates back to the 90s.
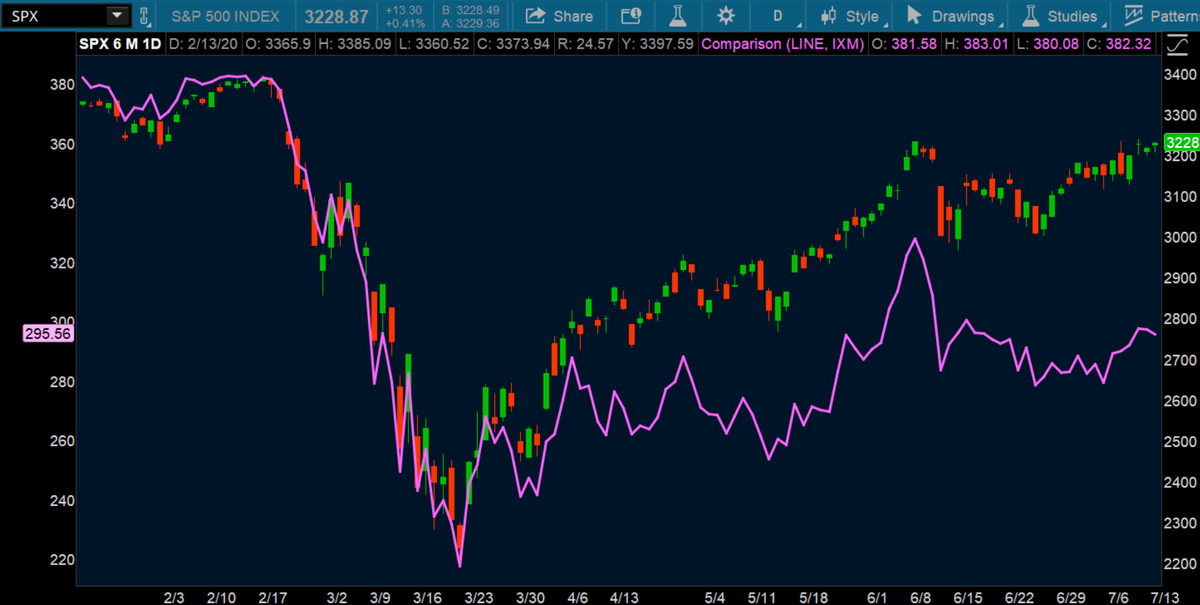
Its interface may look a bit dated but don’t be fooled as it boasts every bit of functionality you might expect from premium software — and it’s free.
Get to know thinkorswim — check out our thinkorswim review.
Thinkorswim’s charts offer numerous screening indicators and countless automated technical analysis tools. You can also view up to 28 charts at the same time pretty much in any configuration you choose as the platform is endlessly customizable.
Thinkorswim also enables you to place orders, create a personalized watchlist, practice with paper trading, build algorithms with its “thinkScript” and much, much more. It also offers paper trading.
On the flip side, the raw power and the endless parade of options that comes with thinkorswim make it pretty complex and somewhat inaccessible. For this reason, I’d mostly recommend it to at least moderately experienced traders.
11. Coinigy – Best Crypto Charting Software
- Overall rating: 4/5
- Ease of use: 4/5
- Cost: $18.66 for Pro Trader, $99.99 for API Dev Pro
Coinigy is widely considered the best crypto charting software. Here’s why. Along with its easy-to-use and information-packed charts, it offers wider utility by offering various advanced technical analysis tools, portfolio tracking, and market trend tracking tools.
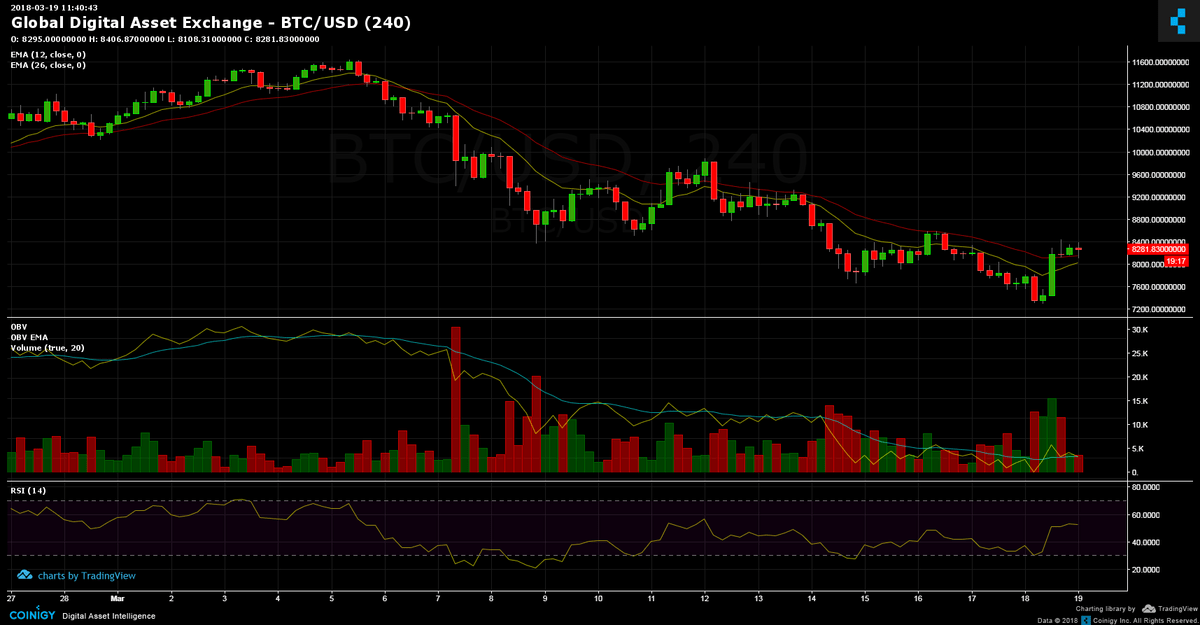
It also gives you the option to set up custom SMS alerts which can be invaluable in the fast-moving and volatile world of crypto.
It is also great for veteran traders seeking to make their entry into crypto as Coinigy’s platform is built on top of TradingView. This means that the interface itself, as well as many of the trading tools available, will feel familiar.
Coinigy also uses information from dozens of crypto exchanges for its data feeds ensuring you’ll always have access to the most accurate and up-to-date information possible.
The main drawback of Coinigy is that it doesn’t offer a free plan. (Coinigy does, however, offer a free 7-day trial.) It offers subscription tiers: Pro Trader for $18.66 per month which should cover most crypto trading needs; it also has an API Dev Pro for advanced users for $99.99/month.
Final Word: Best Charting Applications
All things considered, I believe TradingView is the strongest pick for stock charts. Despite its many technical indicators, real time market data, and comprehensive analysis tools, it remains user-friendly and is suitable for both newbies and seasoned traders.
But as you’ve seen in this article, there are plenty of charting apps and trading software platforms that might be a better pick if you have specific needs — like TradeStation for day traders or Stock Rover for its robust fundamental analysis tools that use real-time data to help you make more informed decisions about stocks you’re considering.
FAQs:
What is the most popular charting software?
TradingView is the most popular charting software. It has tens of millions of active users across the globe and a thriving community of traders that share insights and strategies with each other. Its free offering is flexible and extensive, but TradingView also offers premium plans that unlock additional features like the simultaneous viewing of multiple charts and tens of indicators.
Which chart platform is best?
TradingView is generally considered the best charting platform and is among the most popular. It covers a vast number of assets across multiple classes and is available through the browser, as well as through desktop and mobile apps. It boasts a huge number of customizable indicators and other tools, is highly versatile and customizable, and boasts a large and thriving community of traders.
What is the best free real-time charting software?
Thinkorswim is often considered the best free real-time charting software. It is one of the oldest names on the market and is part of TD Ameritrade. It is robust and feature-packed which can, along with its slightly dated design, prove a double-edged sword as it can be overwhelming for newcomers.
What charts do professional traders use?
While no chart type is a true jack-of-all-traders. professionals tend to use candlestick charts in most situations. They are highly readable and offer a quick insight into key information about an asset including price changes, price trends, the relationship between open and close, and much more.
Where to Invest $1,000 Right Now?
Did you know that stocks rated as "Buy" by the Top Analysts in WallStreetZen's database beat the S&P500 by 98.4% last year?
Our July report reveals the 3 "Strong Buy" stocks that market-beating analysts predict will outperform over the next year.