Lincoln is an investor and content marketer. He has worked for financial advisors, institutional investors, and a publicly-traded fintech company. Lincoln holds degrees in Finance, Economics, and Accounting.
There are dozens of stock charting programs to choose from – how should you choose the best one for you?
It’s actually quite easy, once you know your specific needs and investing style…
The best stock charts for long-term investors will feature different indicators and layouts than the charts that active traders use.
With these differences in mind, I’ve categorized the best charting apps out there by the capacities – and trading styles – they’re best at serving.
Or you can make it easy on yourself, and just choose TradingView – the best stock charts app overall. No other charting app on this list works for as many different trading strategies and use cases.
If you want to read my complete breakdown, read on.
Best Stock Chart Apps
I’ll break down the strengths of the best stock charting websites and software below, their differences, and their pricing.
Here’s a summary:
Rank | Stock Charting Software | Best for |
|---|---|---|
1. | The Best Stock Charts App Overall | |
2. | The Best Broker with Free Trading Charts and Tools | |
3. | The Best Stock Charting Software for Automation | |
4. | The Best Stock Charts for Portfolio Tracking | |
5. | The Best Stock Charting App for News Integration | |
6. | The Best Stock Screener | |
7. | The Best Stock Charts for Long-Term Traders | |
8. | The Best Mobile Stock Charting App | |
9. | The Best Stock Charting App for the Tech-Savvy | |
10. | The Best Free Technical Analysis Software |
I highly recommend trying a few softwares you’re interested in then choosing your favorite.
1. TradingView – The Best Stock Charts App Overall
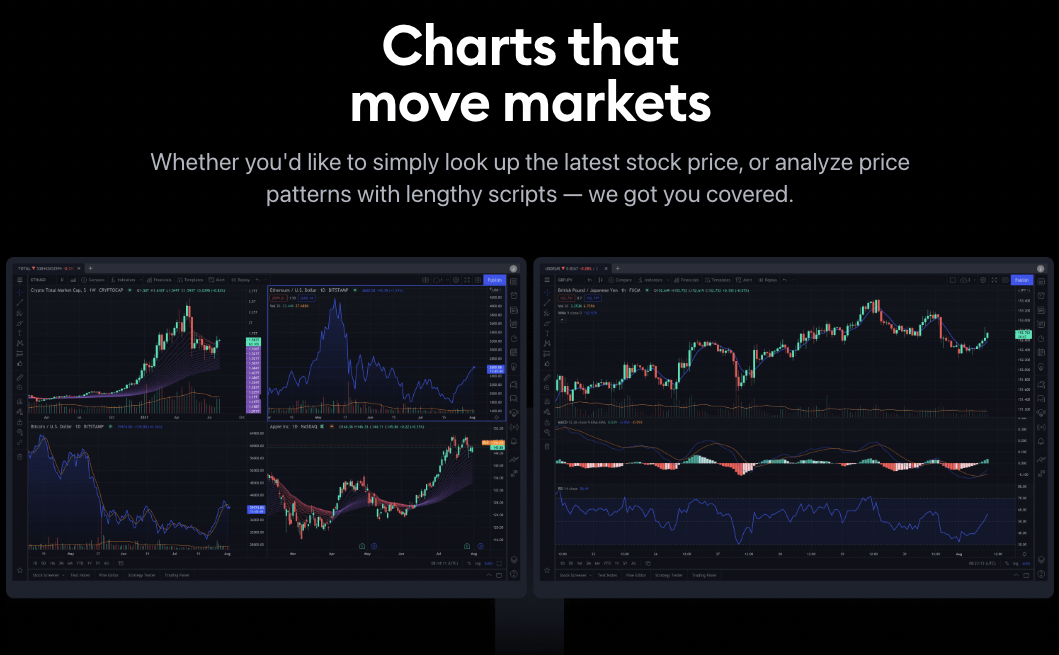
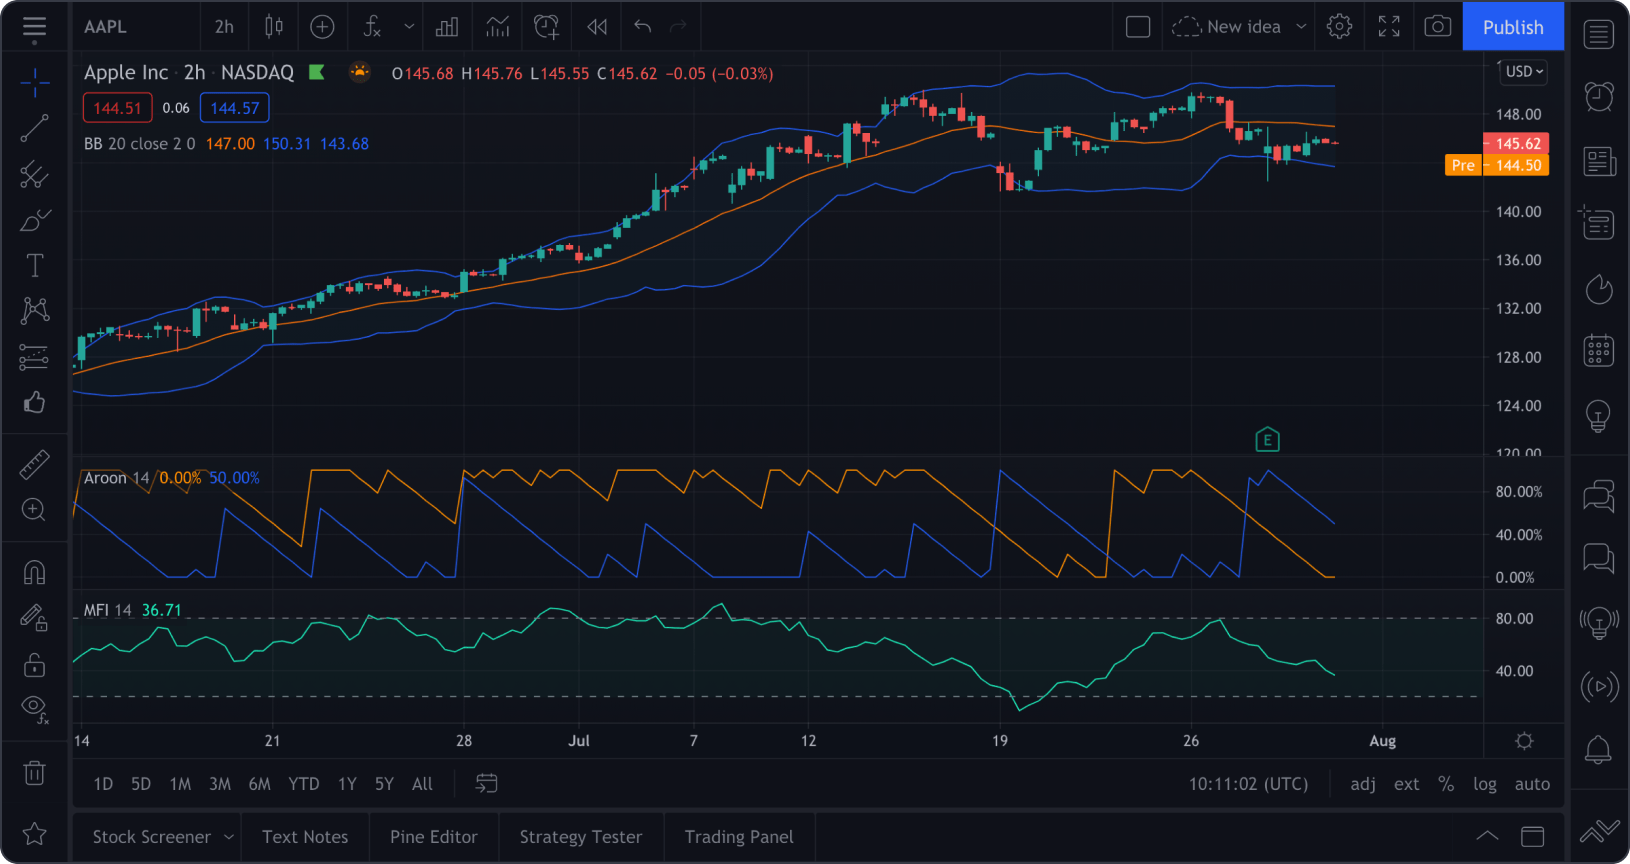
TradingView is the best app for stock charts – full stop. It was built with charting as its main focus, which is reflected in both its power and its wide range of charting applications.
The reason that it’s my charting go-to isn’t because it has the largest number of charting indicators or the widest market reach (although it does). My biggest reason for being a TradingView user is that its charts are really beautiful! Just look at them:
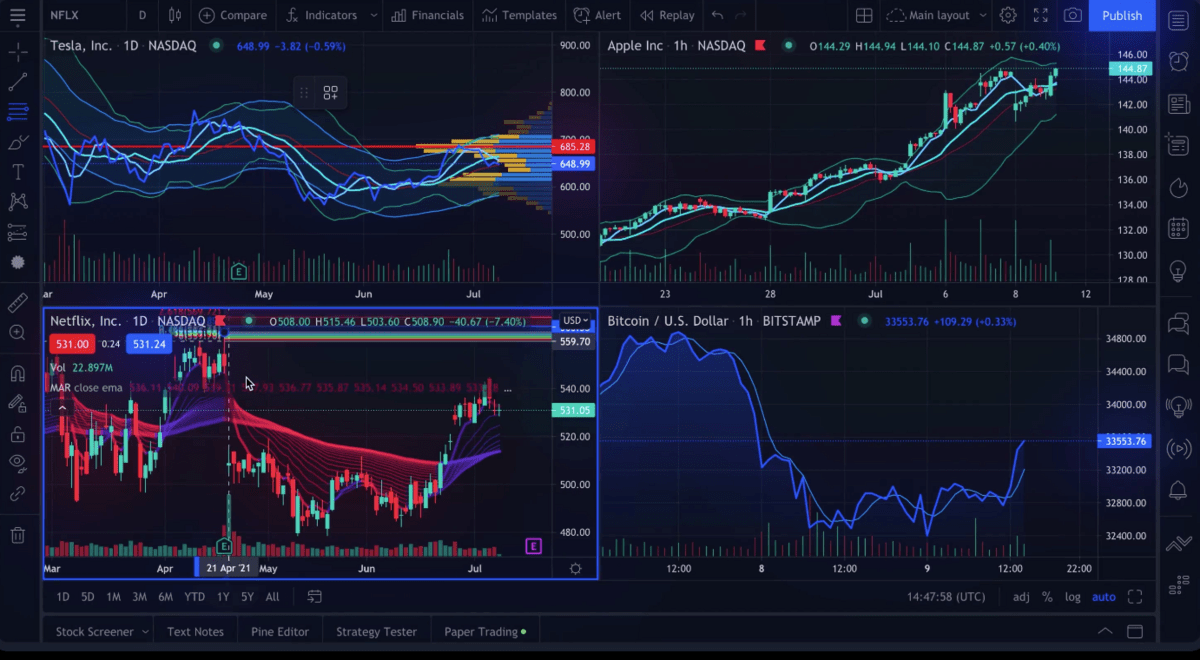
Active traders like me put in hours looking at charts each day. We want those charts to be easy to read, to show us what they mean at a glance. This matters even more if you have multiple displays.
When you are drilling down on one chart, TradingView has the tools to show its information in a variety of ways. You’ll have all of these customization options:
- More technical analysis tools than most other apps – TradingView’s flexible chart visualizations and tools include 14 chart types, 20+ timeframes, 90+ drawing tools, and 100+ pre-built indicators
- Fundamental data charting options – an unusual feature of TradingView is the ability to chart fundamental data from income statements, balance sheets, cash flow metrics, and statistics. This gives traders a clearer idea of how a stock’s fundamentals influence its price action
- A gigantic, active trading community – TradingView’s huge worldwide base is connected via an unrivaled social network, featuring live video streaming and chat. A tangible result of this hivemind are the 100,000+ community-built indicators. For charting geeks like me, this inexhaustible resource gives me both added tools and charting ideas I never would have thought of on my own
Pricing:
TradingView has several price tiers, from free to the $59.95 per month Premium tier ($49.95 per month on an annual basis). My suggestion is Pro+, which sits in the middle at $29.95 per month ($24.95 per month on an annual basis) and has enough versatility for most traders.
With Pro+, you get 4 charts per tab, up to 10 indicators at once, and save your configurations in multiple templates. You can even use 9 indicators to modify other indicators, which ramps up TradingView’s versatility to an exponential degree.
2. TradeStation – The Best Broker with Free Trading Charts and Tools
If you’re looking for a stock charting app, there’s a good chance that you’re also looking for a broker. TradeStation has the best free charting software on the market – and if its proprietary charts aren’t enough for you, it integrates fully with TradingView! That means you can use TradeStation for your broker and make trades directly from a TradingView chart.
But TradeStation’s in-house charts shouldn’t be overlooked. Its custom-built tools include:
- Chart Analysis – a multi-function window where you can look up price data, perform technical analysis, back-test and automate strategies, and show orders and positions
- RadarScreen – one of the most specced-out stock screeners available, featuring alerts and real-time watchlists with 329 criteria built in
- Matrix – this takes all of the tools typically featured alongside charts (a market depth window, buy and sell signals, and an order-entry tool) and puts them into one window
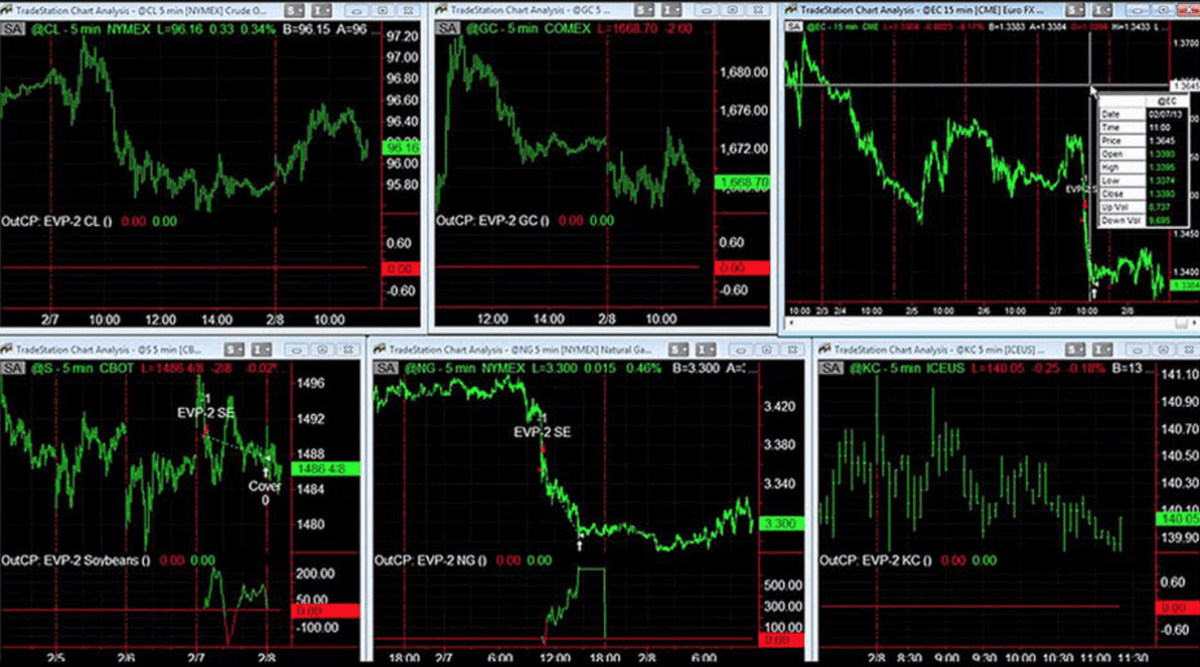
These tools aren’t the only attractive thing about TradeStation’s charting apps. The most powerful platform is the desktop version, which contains nearly 300 indicators and chart studies to go with more than 40 years of historical data.
The mobile app shares this clean look and still has dynamic charting, after-hours visibility, and 44 optional indicators. It even has an advantage over its more powerful siblings – its drawing tools integrate styluses for tablets and phones, so that you can physically draw on your chart.
Pricing:
In these days of no account minimums, trying TradeStation out has no downside at all. Use it as a broker, or use it just for its charts – if it fits your needs, there are few better apps.
3. TrendSpider – The Best Stock Charting Software for Automation
If you like to tinker with your indicators, TrendSpider might be the best chart software for you. After the initial learning curve, I think TrendSpider is simpler to use for advanced technical analysis than other charting options.
TrendSpider is built for the kind of charting creativity you can only accomplish on other software by doing your own coding. This AI-driven assistance can be seen most clearly in the backtesting function. TrendSpider already has the functionality you would normally need to program into a backtesting strategy – the strategy tester lets you easily tweak built-in parameters to revise your backtest on the fly.
If you’re a beginning trader, this may sound overwhelming. But if you’re an advanced trader who understands the value of TrendSpider’s automated functions, this app may just take your trading to a new level.
TrendSpider’s AI brings several more features to the app’s charting:
- Automated trendlines – this is TrendSpider’s trademark feature, and one of the best examples of its improvement over the status quo. It automatically plots trendlines and can even flag the ones with the best backtested success
- Candlestick pattern recognition – learning to read Japanese candlesticks is one of the bedrocks of modern technical analysis. TrendSpider can detect over 40 different types of candlestick patterns, giving you insight into bearish or bullish patterns shown in a single chart point
- Dynamic price alerts – TrendSpider lets you build chart patterns into your price alerts, instead of just price thresholds
Pricing:
Yearly plans range from $33 to $97 per month.
The Elite tier ($65/month) gives access to everything I like about the platform – a big plus over the entry package is its ability to use intraday price data instead of just daily. Try it and see if it makes a difference in your trading.
4. Stock Rover – The Best Stock Charts for Portfolio Tracking
Stock Rover is my favorite app for easily tracking one – or many – portfolios. That makes it useful for active investors who want to equip themselves with the same tools that professional financial managers have at their disposal.
In the case of Stock Rover’s Premium Plus plan, that’s over 700 financial metrics to select from!
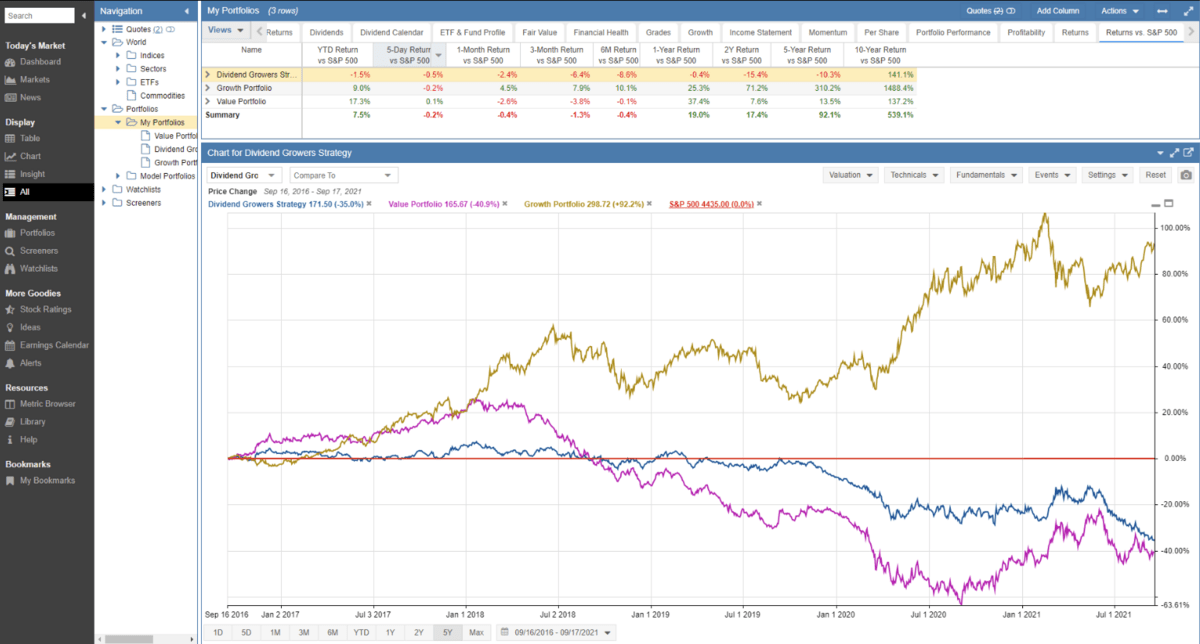
Stock Rover’s intuitive portfolio management makes it simple to customize charts for price, comparative performance, and a range of other modifications. It can also provide automated portfolio reports, portfolio analytics for individual positions and portfolios, price alerts, and portfolio rebalancing support. It easily integrates with over 100 brokers, making setup a breeze.
When you’re looking for the best chart software for your needs, you shouldn’t focus on a checklist of capabilities. Yes, Stock Rover is powerful – but what makes it the best stock charting program for portfolios is just a handful of its features.
Its 4 valuation charts are among the most useful for quickly evaluating investments from multiple perspectives.
There is also an adjustable benchmark comparison feature that lets you compare the performance of your portfolio against benchmarks like the S&P 500, an ETF, or another portfolio.
Pricing:
Stock Rover’s plans range from $34/month for Premium to $199/month for Ultimate Pro – annual and 2-year commitments bring that down by up to 40%. I’d recommend at least the Premium Plus plan if you want to unlock all of Stock Rover’s nifty tricks, like its valuation charts — or step up to the Ultimate tier if you want advanced screeners and the Analyst Ratings tools on top of that.
5. Benzinga Pro – The Best for News Integration
Benzinga is one of the most recognized names in trading news. The charting platform built around Benzinga’s newswire is unsurprisingly built to leverage this strength.
Full TradingView chart integration is part of the package. All of the features that make TradingView the best stock charts app make Benzinga Pro a great option, albeit at a higher price point.
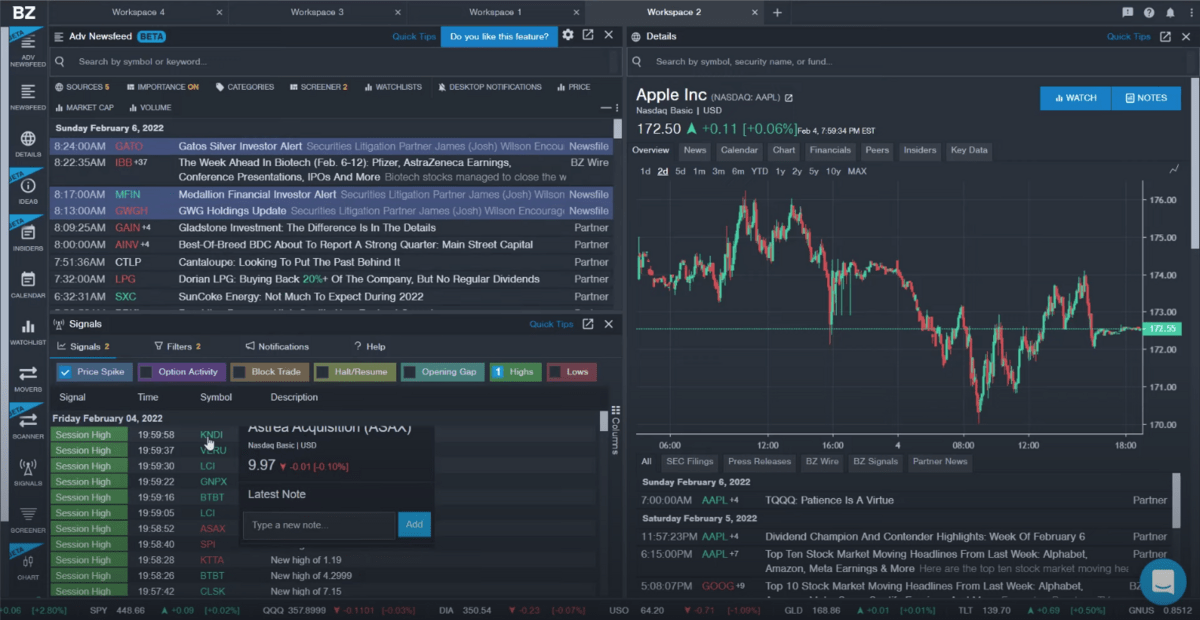
You already know what you get with TradingView’s charts, so let’s drill down on what makes Benzinga Pro unique – its news integration.
Benzinga Pro’s highly customizable news feed incorporates Benzinga’s active newswire, which publishes 50–60 articles on trading developments per day. There’s also a paid feature that is great for active traders – BZ Signals.
The BZ Signals feed delivers alerts on tradeable chart signals in the following categories:
- Price Spike – significant and sudden price changes
- Option Activity – unusual options trading
- Block Trade – high-volume trades executed outside of the public market
- Halt/Resume – circuit breaker halts
- Opening Gap – big price change between yesterday’s close and today’s open
- Highs – daily or 52-week highs
- Lows – daily or 52-week lows
Its Squawk feature is a real-time audio feed staffed by Benzinga analysts, alerting breaking news. This can be very helpful if you’re a trader who trades on news and other market events.
Pricing:
Benzinga Pro has a free version, plus three paid tiers. The free version and Basic tier – which costs $27 per month – are both limited by 15-minute delayed quotes. This makes them a better fit for longer-term traders, who will be looking to this chart app more for news than power charting.
The Essential plan, which costs $197 a month (or $166 per month annually), unlocks features like BZ Signals and Squawk, as well as real-time data. If your trading edge is based on news, this plan is the best value.
6. Finviz – The Best Stock Screener
Finviz debuted in 2007 and remains the website of choice for many who want to quickly look up a stock’s chart with minimal hassle.
Its interface looks pretty much the same as it did 15 years ago. Hiding behind Finviz’s deceptively simple interface is a powerful and versatile stock screener.
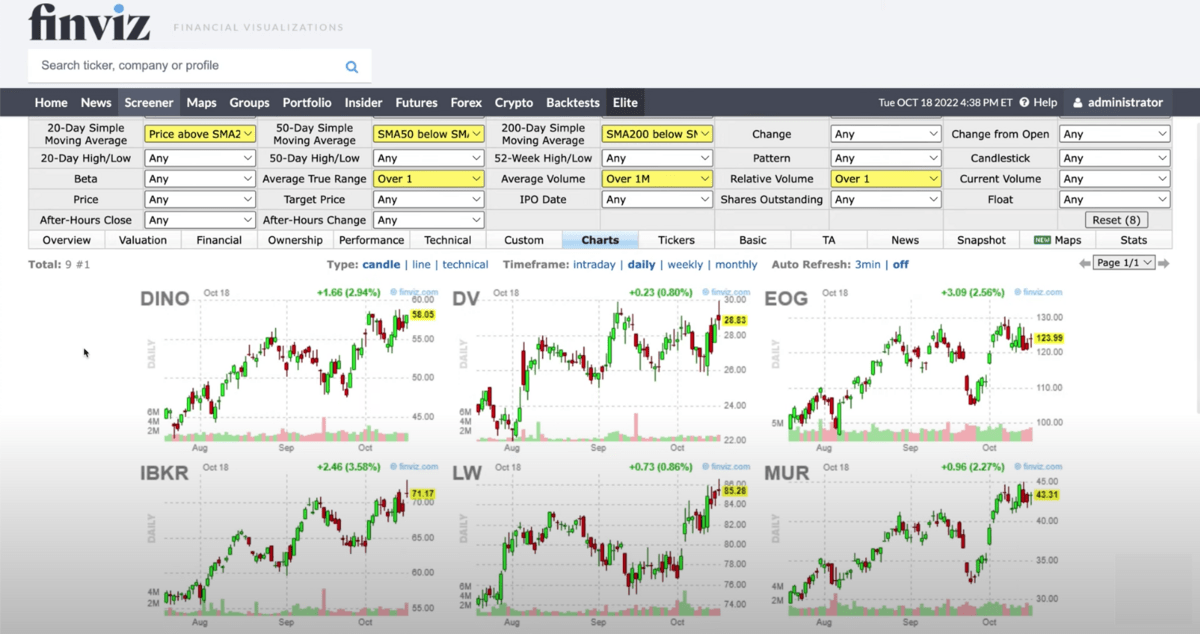
The screener lets users select from 67 descriptive, technical, and fundamental filters – the results can be saved by registered users on Finviz’s free tier.
There are 13 different viewing options for a stock screen. Charts are only one of the options. The other options include technical indicators, fundamental indicators, heat maps – basically any method for comparing stocks that you can imagine.
This clean, easy to customize interface makes Finviz one of the best websites for stock charts to my mind.
Pricing:
Though Finviz ranks among the best free charting software, Finviz’s Elite level is what I’d recommend to investors interested in this platform. It delivers Finviz’s trademark stock screening – along with real-time quotes, intraday charts, and advanced charts that make Finviz truly useful for trading. The monthly subscription is $39.50 per month, but annual is the better deal at $24.96 per month.
7. StockCharts – The Best Stock Charts for Long-Term Investors and Traders
Much of StockCharts’ popularity comes from its free plan, which lets its users export and share charts — see StockCharts pricing for more info on this. Although it lacks a lot of the functionality of other free products on this list, StockCharts’ fans have embraced its limitations as strengths. For those who like simplicity in their charts, StockCharts delivers what they’re looking for without the bells and whistles.
One of StockCharts’ limitations is its auto-refreshing charts. Unlike dynamic charts, which are constantly charting a stock’s real-time prices, StockCharts refreshes its charts on a 5–15 second delay.
This makes StockCharts less useful for day traders, who rely on second-to-second price fluctuations to make their strategy profitable.
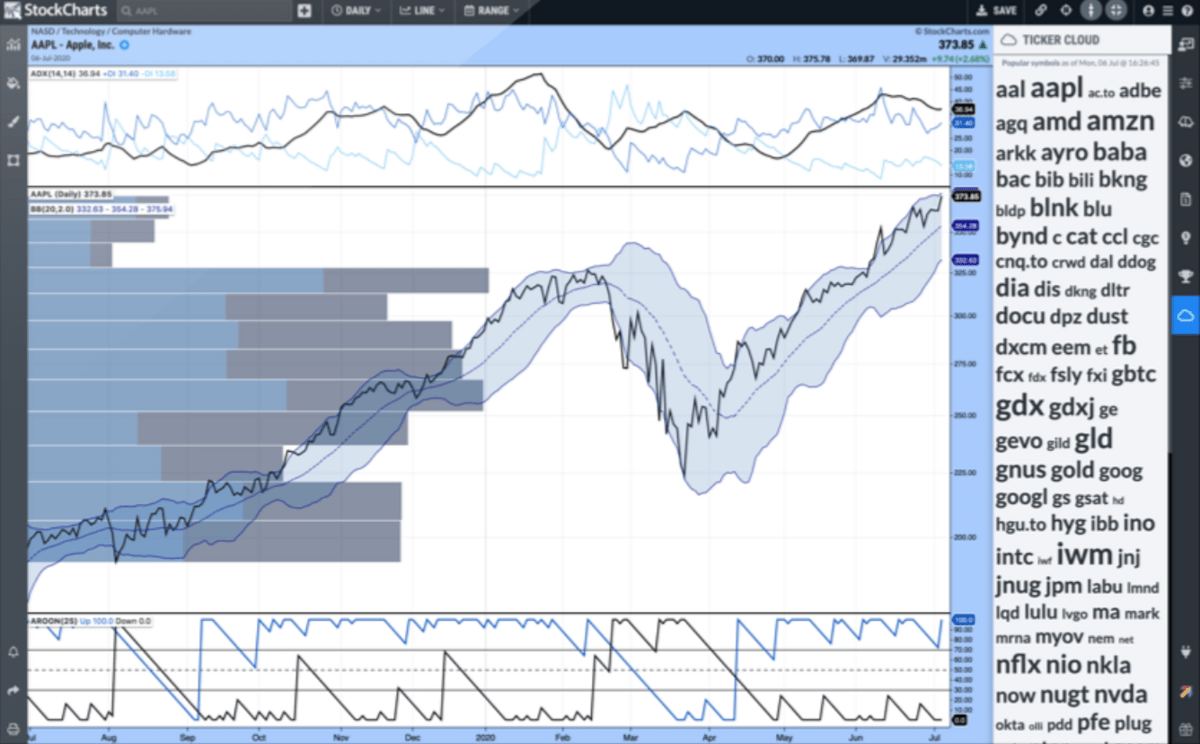
StockCharts’ vast resources are aimed at long-term technical and fundamental analysis. I’m an active trader, so I tend toward dynamic charting options like TradingView, but I appreciate StockCharts’ emphasis on presenting different, clear charting options.
I particularly like these charting options:
- PerfCharts – these charts will overlay up to 10 tickers on a single chart
- Point & Figure Charts – these old-school charts plot price action with Xs and Os, making it easier to filter out micro price movements
- Seasonality Charts – these charts let you analyze trends over an adjustable timeframe
Pricing:
StockCharts’ Basic plan, which costs $14.95 per month, will give traders the ability to use 25 technical indicators per chart as well as 25 technical overlays. This is the bare minimum that you need to unlock StockCharts’ charting capabilities.
The Extra and Pro level plans are a step up at $24.95 and $39.95 respectively, and give traders access to StockCharts’ scanning and charting customizability. All of these tiers deliver a bargain for the power and versatility they afford.
8. Webull – The Best Mobile Stock Charting App
The best charts are the ones you use the most, especially if you’re an active trader. And Webull’s mobile charting app is second to none.
Webull has a different target audience than most of the charting apps on this list. Its users value speed and accessibility more than a wide range of services and technical indicators.
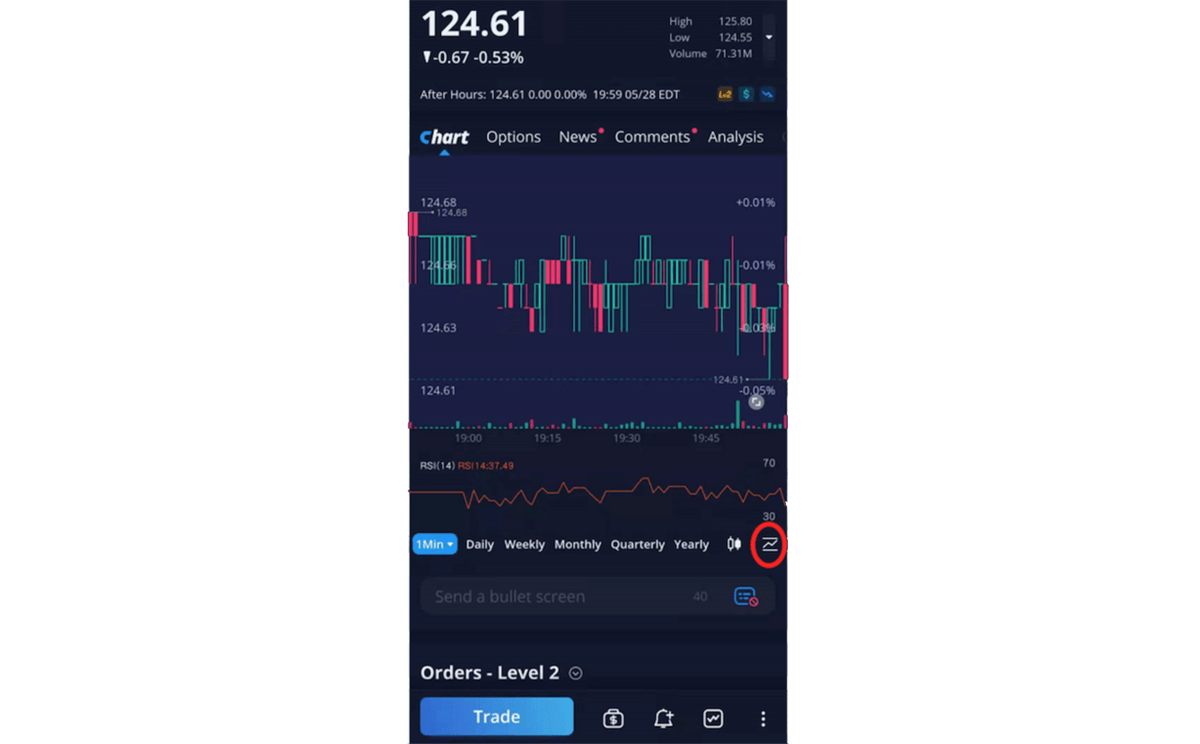
Webull’s chart app comes with another caveat – it’s connected to a broker. As a broker, Webull again targets a younger, more tech-savvy set. Unlike Webull, the other brokers on this list offer broker-assisted trades, thousands of mutual funds, and access to OTC penny stocks. Webull concentrates on lower fees and a streamlined user experience.
Pricing:
Webull is free.
9. Interactive Brokers – The Best Stock Charting App for the Tech-Savvy
If you’re considering broker-connected charting software, Interactive Brokers (IBKR) is one of the most robust options available.
IBKR’s suite of trading software ranges from its powerful desktop platform Trader Workstation to more niche offerings like IBKR GlobalTrader and Impact, its socially-conscious ESG app. All of these software options are free with an IBKR brokerage account. TradingView integration is even supported with this broker.
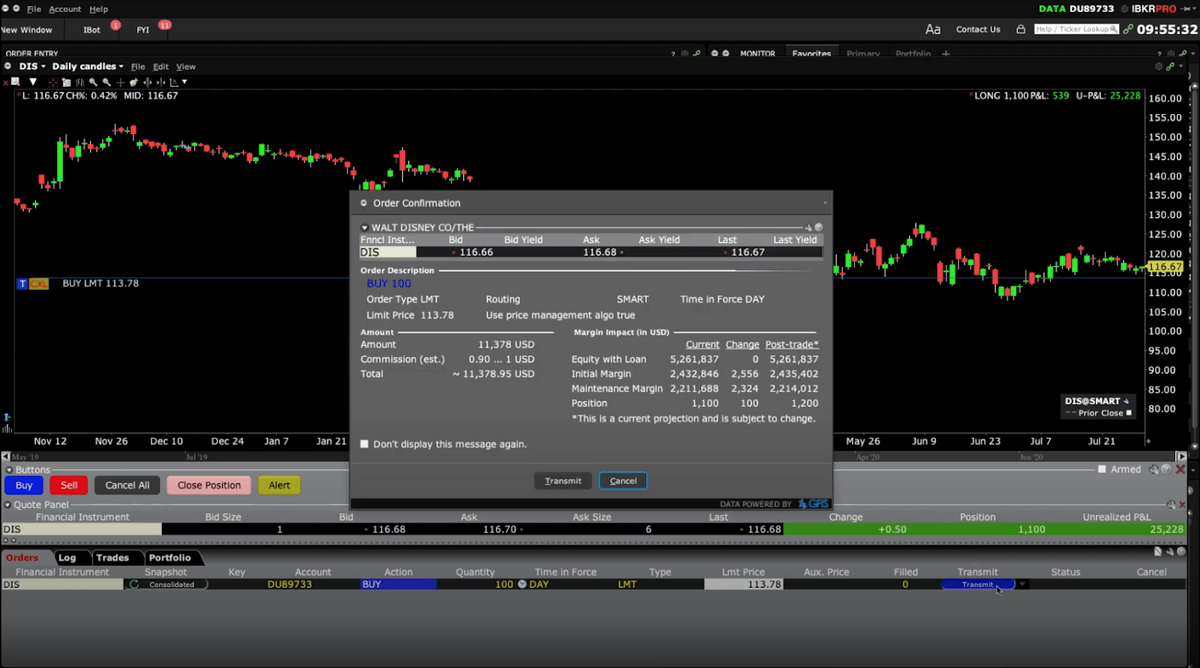
While most reviews of IBKR concentrate on its prowess as a broker – it has global reach, low margin rates, and awesome executions – IBKR’s charting apps compare well with both free and paid alternatives.
Trader Workstation separates itself in the following ways:
- It has a ton of technical indicators – the 120+ technical indicators and overlays you can chart range from the standards to exotic indicators like ADX/DMI and the Zigzag
- Hot key trading integration – when you measure your executions in milliseconds as IBKR does, trading directly from the chart with a well-integrated broker platform can make a big difference
- Wide global reach – you can chart and trade stocks, options, futures, currencies, mutual funds, and crypto in over 150 global markets
Pricing:
IBKR Lite charges zero commissions on most trades, while IBKR Pro charges small commissions in return for more control over order routing, lower margin rates, and other trading advantages.
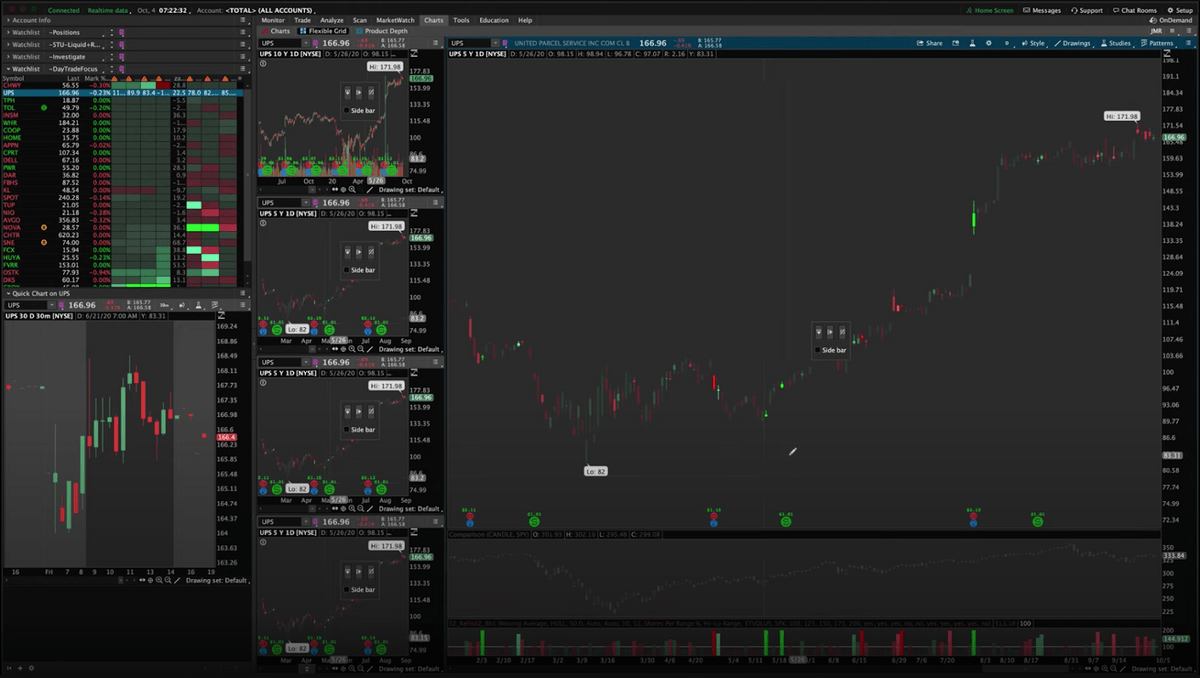
10. thinkorswim – The Best Free Technical Analysis Software
TD Ameritrade’s flagship charting app thinkorswim was one of the first power applications on the market. Although it can appear a bit dated, it’s still one of the best desktop, web, and mobile charting apps available.
This advanced tech can be a double-edged sword – thinkorswim is packed with so many innovations and techniques that you may get bogged down in learning about them, or stop your education when you know enough to carry out your trades.
Either option won’t deliver the trading experience that thinkorswim is built for. If you aren’t tech inclined, there are better charting app options.
For those excited about the prospect of limitless power to unlock, thinkorswim may be a good choice. The following tech sets this app apart:
- Configurable modules and grids – thinkorswim’s chart grid can display up to 28 charts in many configurations, and its trading modules let you design your workstation to your own style
- Super gadgets – this menu of add-ons includes customizable trade buttons and an innovative trading ladder visualization, which reconfigures the market depth window into an easy-to-scan vertical column
- Analyze tab – this allows you to quickly call up a risk graph for potential trades
Pricing:
thinkorswim is a free charting program that comes with a no-minimum brokerage account.
Final Word: Best Stock Charts App
The best stock charts app in my experience is TradingView. It’s the most widely used stock charting program in the world, with 30 million-plus monthly users. That number gets even larger when you count the TradeStation, Benzinga Pro, and Interactive Brokers traders who rely on its charts.
As with everything in the market, the best chart software for you depends on your trading strategy, budget, and what you’re comfortable with. If you’re looking for the best free charting software – attached to a solid broker – I recommend TradeStation.
FAQs:
What is the best free stock chart app?
TradeStation is the best free stock chart app available. Features like its Matrix market depth window are the equal of paid features in the rest of the best apps for stock charts.
Which one is the best app for stock market trading?
TradingView is the best app for stock market trading. With its 100,000-plus community built chart indicators, it offers the most customizable charts of any stock charting program.
What is the best website for stock charts?
TradingView is the best website for stock charts. The free version gives you access to a wide array of indicators, drawing tools, and different visualization options for your stock chart.
Where to Invest $1,000 Right Now?
Did you know that stocks rated as "Buy" by the Top Analysts in WallStreetZen's database beat the S&P500 by 98.4% last year?
Our July report reveals the 3 "Strong Buy" stocks that market-beating analysts predict will outperform over the next year.