Lincoln is an investor and content marketer. He has worked for financial advisors, institutional investors, and a publicly-traded fintech company. Lincoln holds degrees in Finance, Economics, and Accounting.
Need charts? TradingView is the best app for stock charts – full stop. It was built first and foremost as a charting platform, which shines through in both its power and its wide range of charting applications.
As an active trader, you spend hours each day looking at charts. You want them to be easy to read and to show what you want to see at a glance — especially if you have a multi-monitor setup.
TradingView has the tools to show its information in a variety of ways. You’ll have customization options like 14 chart types, 90+ drawing tools, and 100+ pre-built indicators.
Even the free tier of membership is great — but the (still-affordable) paid subscriptions are even better. Try it free for 30 days and see for yourself — click the link below.
Common human psychology says, “When danger strikes either one fights or flights.” The same is the case with investor sentiment, giving traders who can control their emotions ample opportunities for profiting from reversals.
During a downtrend, the best traders remain patient and allow the perfect setup – where the bears become exhausted and the bulls have been waiting for the right time to buy their favorite stock at bargain prices. The lack of sellers and plethora of buyers create a highly profitable setup, if you can spot the reversal before it happens.
One of the most reliable reversal trends traders use in a downtrend is the inverse head and shoulders pattern.
Let’s discuss the inverse head and shoulders strategy, what it looks like, its pros and cons, and how to trade it.

What Is an Inverse Head and Shoulders Pattern?
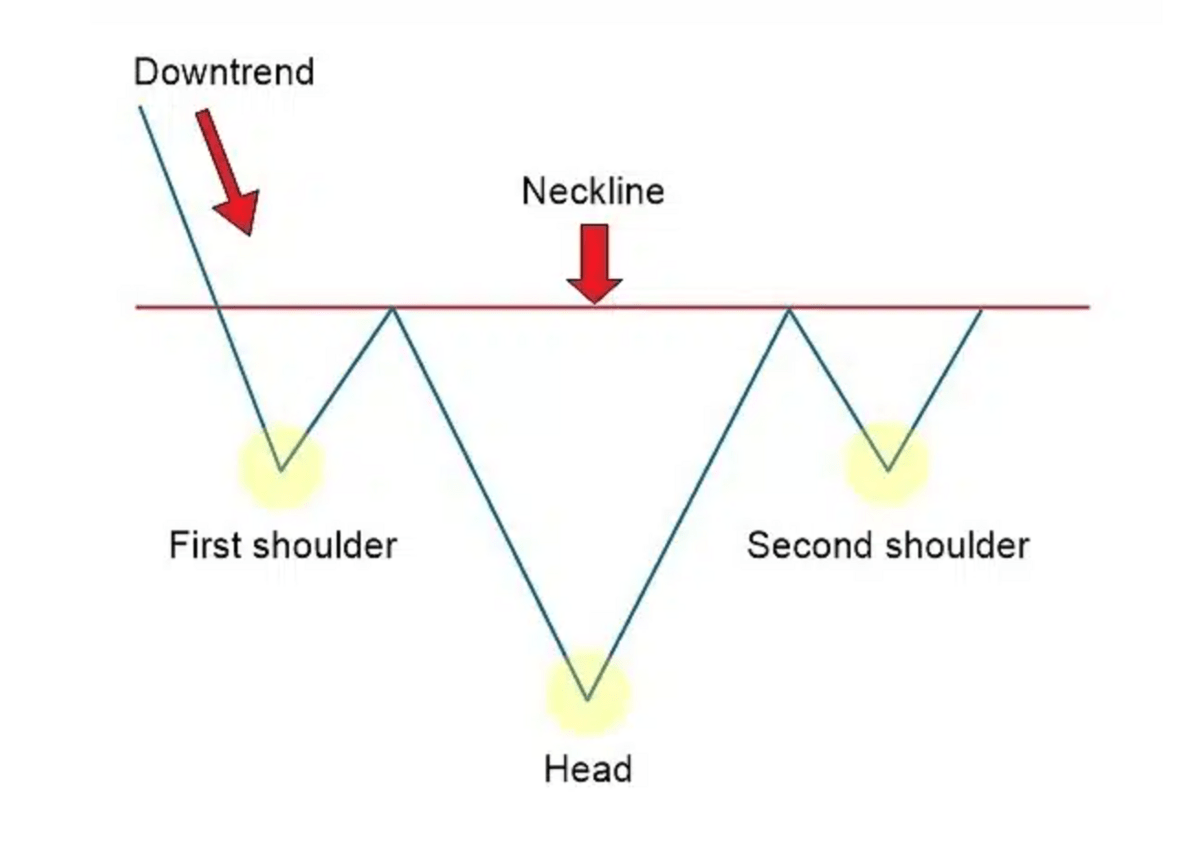
The inverse head and shoulders pattern is a technical indicator that signals a potential reversal from a downward trend to an upward trend. The pattern appears as a head, 2 shoulders, and neckline in an inverted position.
A traditional head and shoulders pattern indicates a bullish to bearish trend, whereas the inverted head and shoulders signals the opposite.
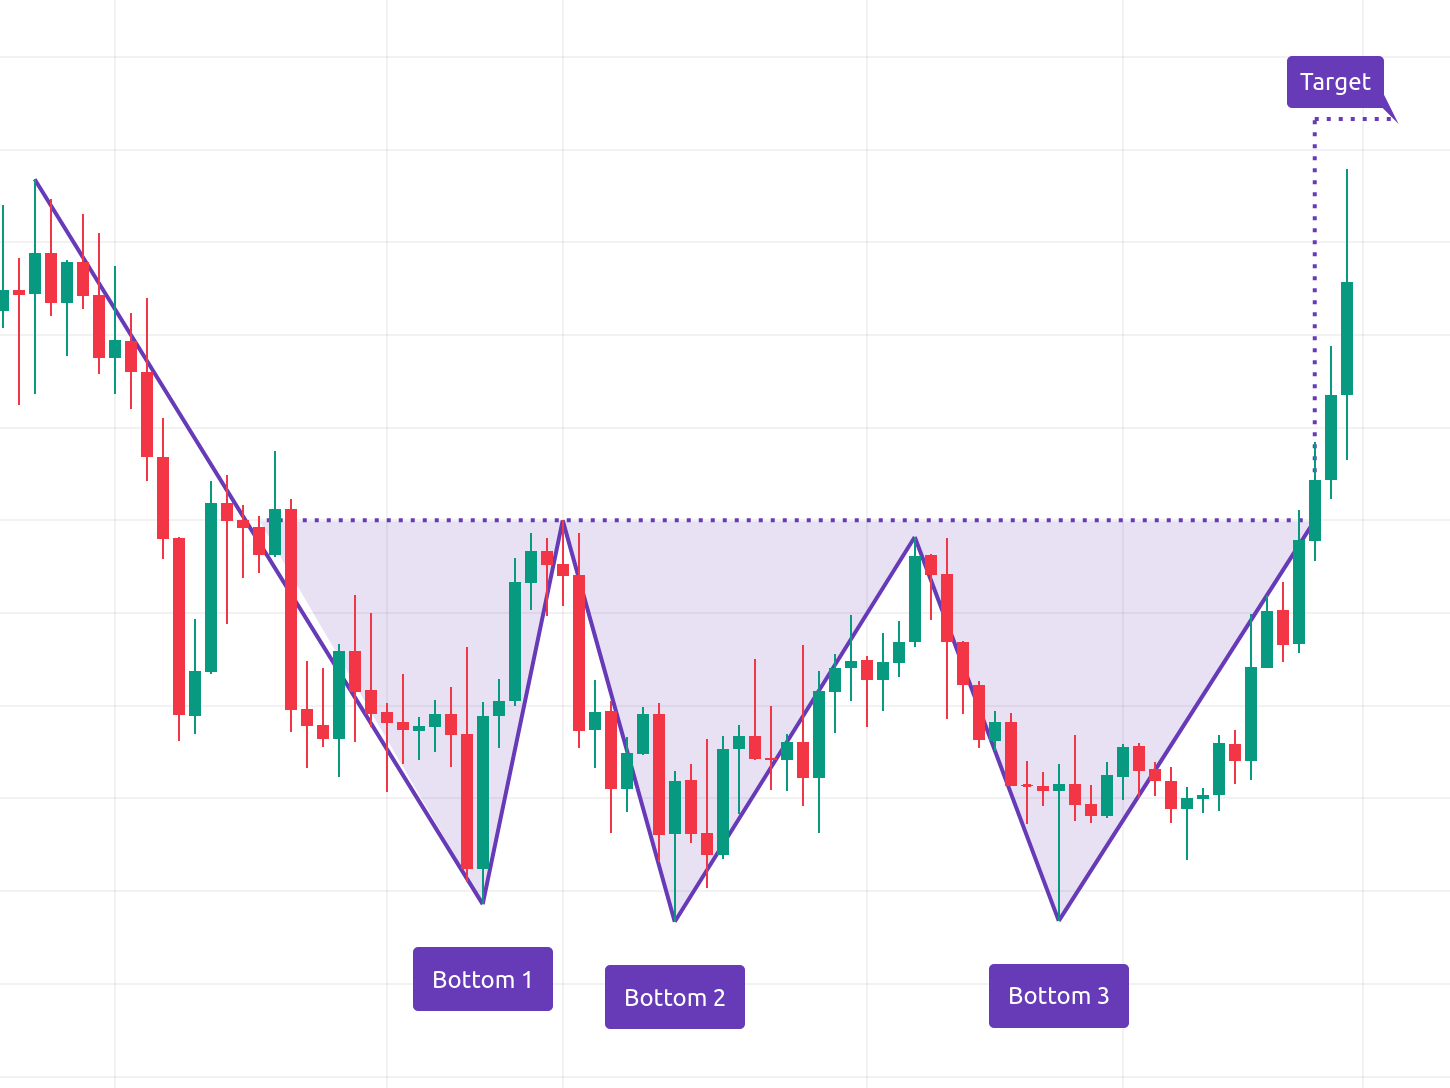
There are four main components of a reverse head and shoulders pattern. Three troughs form the first shoulder, head and second shoulder. The two high points, or pullbacks, form the neckline in the pattern. The neckline is also known as the resistance line.
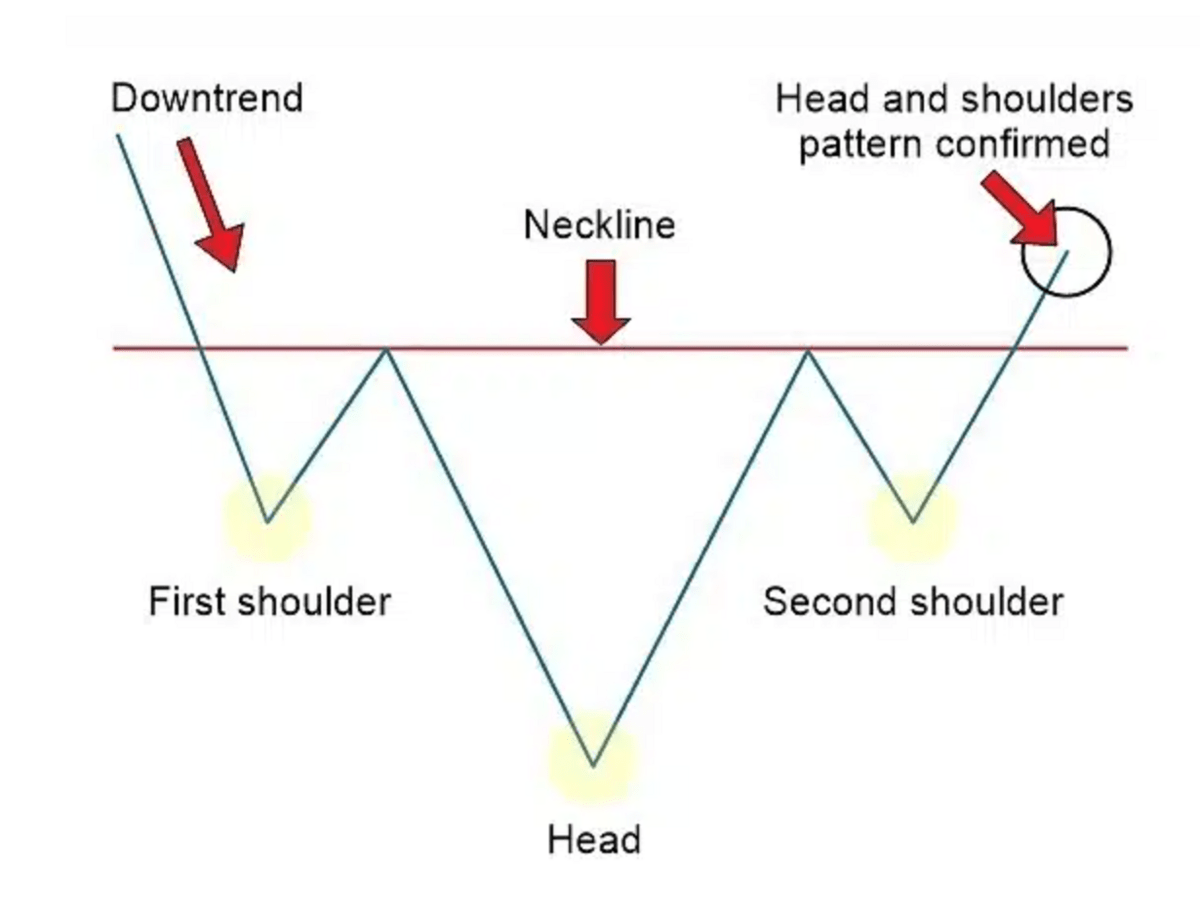
The pattern can be confirmed once the market closes above the neckline after the second shoulder is formed. This is also known as the breakout. Strong buyer volume is what helps push prices up consistently to reach the breakout.
During the downtrend, bulls will wait on the sideline waiting for the stock to find support. Once the bottom is formed, the influx of buyers pushes the price up. Simultaneously, sellers have been exhausted after the long downtrend. This setup creates large potential for profit, as buying pressure completely overwhelms selling pressure.
The Components of an Inverse Head and Shoulders Trading Pattern
Let’s take a look at the four components that make up the formation.
- Left Shoulder – This first trough is formed after a bearish run and low trading volume. The increase forms into a trough and looks like a ‘shoulder.’
- Head – The head is formed as prices fall below the left shoulder trough, then begin to increase again. The rally meets resistance again at the neckline, pushing the price back down.
- Right Shoulder – Prices fall again, similar to the left shoulder trough level, before increasing once more. It’s important to remember at this point the pattern is not confirmed yet.
- Neckline – The line connecting the first and third pullback. The neckline is the level of support or resistance traders use to determine placing an order.
How do you know the pattern is complete?
Once the market begins trading above the neckline, the reverse head and shoulders pattern is confirmed, signaling your entry point into a bullish position.
You might be interested in Investors Underground, a day trading community with exceptional educational materials.
IU offers 3 trading courses with a track record of transforming brand-new traders into full-time trading professionals.
How to Trade a Reverse Head and Shoulders Pattern
It’s important when trading a reverse head and shoulders pattern to allow the formation to complete. Similar to the traditional pattern, this happens when price action breaks above the neckline after the right shoulder.
Volume is more important in the inverse pattern compared to the traditional head and shoulders pattern. When prices are going up after the right shoulder, the breakout occurs with strong buyer volume. You can use the inverse head and shoulders pattern in combination with high volume to enter your long position.
Let’s break this down step-by-step.
- Identify the pattern – After a downward trend, three troughs form a left shoulder, head and right shoulder. The two shoulders are connected by a neckline.
- Strong volume forces a breakout – After the right shoulder forms, strong buyer volume will push prices above the neckline. This is the breakout and verification of a price reversal.
- Entry point – Once the price breaks above the neckline, enter a long position with the expectation prices will continue to rise.
- Reduce risk – Consider setting a stop-loss at the right shoulder. This will ensure your purchase takes place only if volume pushes prices above your stop-loss price.
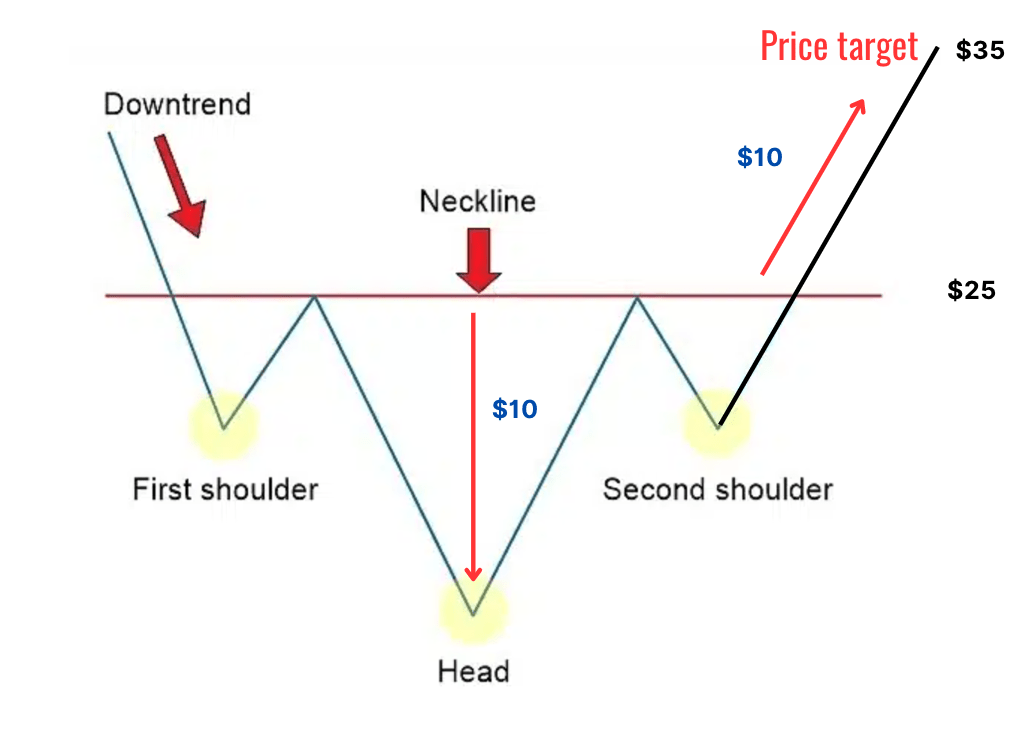
- Determine price target for profits – Measure your price target by calculating the spread between the neckline and head. Project this spread as the amount the price will rise above the neckline.
To determine a price target, measure the distance from the bottom of the head up to the neckline. This is your spread. If the spread is $10, you’d be able to estimate that the stock price may increase $10 above the neckline level.
The Ultimate Day Trading Setup
- The best brokerage for day trading: TradeStation
- The best day trading ecourses & community: Investors Underground
- The best day trading computer: Radical X13
- The best charting platform: TradingView
Let’s put it all together: Stock ABC just formed the right shoulder and is trading at $25 per share, the neckline. You purchase 100 shares for $2,500. The share price moves from $25 to $35 and hits the projected target, where you sell the 100 shares for $3,500.
The profit is 100 shares x $10 = $1,000
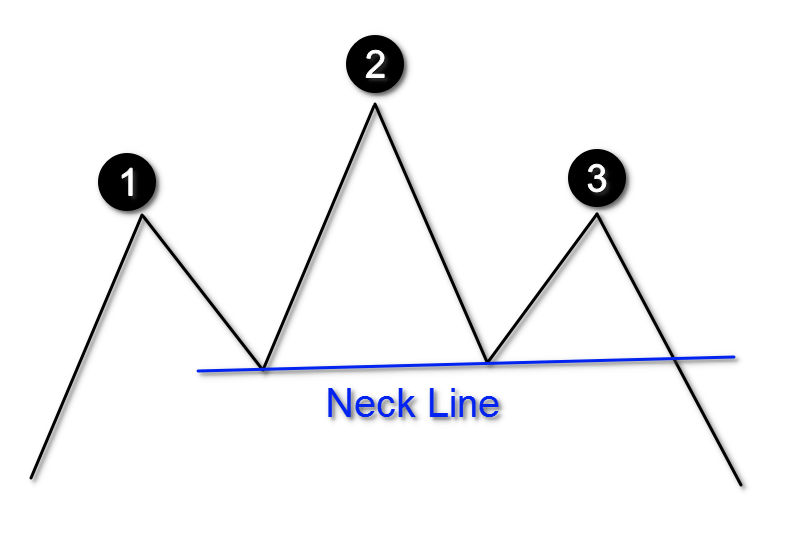
What Is a Head and Shoulders Pattern?
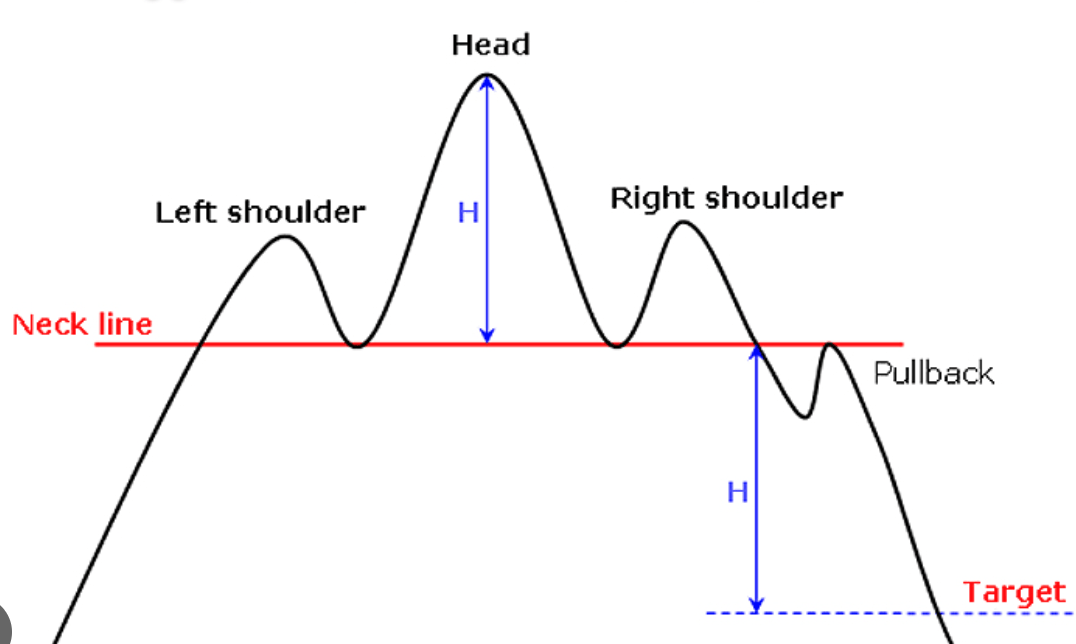
The traditional head and shoulders pattern has similar characteristics as the inverse pattern. The key components are the left shoulder, head, right shoulder and neckline. However, it is a bearish reversal pattern which signals a previously rising stock may fall.
Here’s how the same components differ from the inverse pattern:
- Left Shoulder – This first peak is formed after a bullish run and high trading volume. The decline forms into a trough and looks like a ‘shoulder.’
- Head – The head is formed as prices rise above the left shoulder peak, then begin to decline again.
- Right Shoulder – Prices rise again, similar to the left shoulder peak level, before declining once more.
- Neckline – The line connecting the first and third trough. The neckline is the level of support or resistance traders use to determine placing an order.
Whether you’re looking at a traditional or inverse head and shoulders pattern, remember the pattern is not confirmed until prices break the neckline AFTER the right shoulder. This is known as the breakout and signals your potential entry point.
Pros and Cons of Trading an Inverse Head and Shoulder Pattern
Pros | Cons |
Easy to identify for experienced traders | Pattern isn’t always perfect, novice may overlook |
Profit opportunity in all markets | Long wait periods for patterns to develop |
Historically reliable trading pattern | Patterns can be subjective |
How Reliable Is a Reverse Head and Shoulders Pattern?
The reverse head and shoulders stock pattern is easy to identify and considered a reliable technical indicator. Paying close attention to volume is key, as this is required to complete the pattern. Once strong volume pushes the price above the neckline, the price reversal can be confirmed and an entry point is revealed.
The downside of a widely known reliable pattern is that some traders see the pattern beginning to form and they will enter the trade too early – immediately after the right shoulder is formed. To ensure success volume must reinforce the pattern by pushing prices above the neckline.
The novice trader may anticipate the pattern at the right shoulder to attempt maximizing gains. This tactic may work but only if strong volume helps to complete a rally to break through the neckline.
That said, most traders will not solely trade based on the reverse head and shoulders stock pattern. They will use other volume indicators to help verify trend reversals.
Final Word: Inverse Head and Shoulders Pattern
The inverse head and shoulders pattern is used to signal the end of a downtrend and the beginning of an upward trend. Volume is crucial to identify the pattern, more so than in the traditional head and shoulders pattern. In order to confirm the pattern after the right shoulder, volume must be strong for the price to rise above the neckline to demonstrate a breakout.
When that pattern does form and the volume leading to the breakout is significant, traders can often ride the uptrend for relatively large price movements, which create large profits.
While it’s not the most common pattern, its reliability and high profit potential make it a pattern that should always be on your radar.
FAQs:
What does an inverse head and shoulder pattern indicate?
The inverse head and shoulder pattern signals the end of a downtrend and the beginning of an uptrend. By identifying a left shoulder, head and right shoulder, volume will help to confirm the completion of the pattern by breaking above the neckline.
Is an inverse head and shoulders bullish?
An inverse head and shoulders pattern is considered bearish to bullish. After the pattern is confirmed, stock prices are expected to rise.
Is a head and shoulders pattern bullish or bearish?
Contrary to the inverse head and shoulder pattern, the traditional head and shoulder pattern is considered bullish to bearish. After an uptrend, a left shoulder, head and right shoulder will appear before prices begin to fall.
Where to Invest $1,000 Right Now?
Did you know that stocks rated as "Buy" by the Top Analysts in WallStreetZen's database beat the S&P500 by 98.4% last year?
Our June report reveals the 3 "Strong Buy" stocks that market-beating analysts predict will outperform over the next year.