Nate is a serial entrepreneur, part-time investor, and founder of WallStreetZen. He holds a Juris Doctor (JD) degree from UAlberta Law - but don’t hold that against him. He’s passionate about building great software that delights users. He occasionally writes about himself in the 3rd person.
If you’re a day trader, you already know the 2 key elements of trading: Price action and volume.
Almost every strategy, indicator, charting system, and drawing tool uses one or both of these elements. Successful traders know the importance of understanding price action and volume and, more importantly, how they relate with one another.
Although seeing volume with the naked eye is not difficult, interpreting the volume is. It’s very difficult to make quick, unbiased decisions based on only price action and volume – that’s where indicators come in.
Volume indicators are visual representations of the interplay between price action and volume. For many traders, since price action and volume make up 80% or more of their trading strategies, a good volume indicator or two is a critical component of their success.
Special Offer: Moomoo x WSZ
We have partnered with moomoo, one of the top trading brokerages in 2026.
On moomoo, you can:
- Trade stocks, ETFs, and options commission-free
- Access moomoo’s Earnings Calendar and Earnings Hub
- Get real-time Level 2 market data for free
Plus, our readers can get up to60 free stocks using the link below:
I’ve been day trading for about 5 years and have tried at least 15-20 different tools. Here are 4 of the best volume indicators for day trading that you should consider incorporating into your trading strategy.
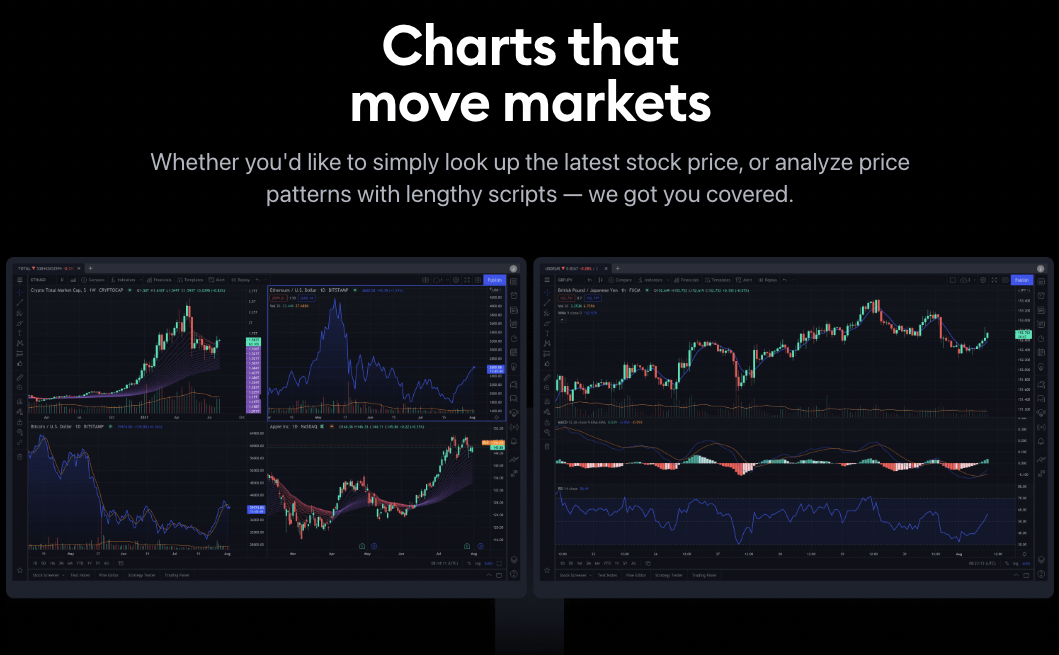
Personally, I use TradingView to trade, so that’s the platform I share all of my examples in. That said, all 4 of these indicators are available on a wide range of trading platforms.
If you’d like to try TradingView, you can sign up with the button below for a 30-day free trial of TradingView (I always recommend Pro+ because it gives you 10 indicators per chart and 4 charts in one layout, necessary minimums for serious traders):
The 4 Best Volume Indicators
Here is my list of the 4 best volume indicators for day trading:
1. On-Balance Volume (OBV)
On-Balance Volume (OBV) is a volume indicator that sums volume on up days and subtracts volume on down days. By doing this, the indicator shows the general direction of the stock based on the conviction behind each day’s move.
The OBV indicator was created based on the principle that greater volume behind a particular move means greater conviction. 10 million shares traded is more significant than 1 million shares traded, regardless of the direction.
If the stock closes higher today than it did yesterday, then all of the day’s volume is considered up volume. If the stock closes lower today than it did yesterday, then the volume is considered down volume.
Rather than the OBV value itself, traders should focus their attention on the direction the indicator is pointing.
If prices are rising and the OBV is making higher peaks and higher troughs, the upward trend is likely to continue:
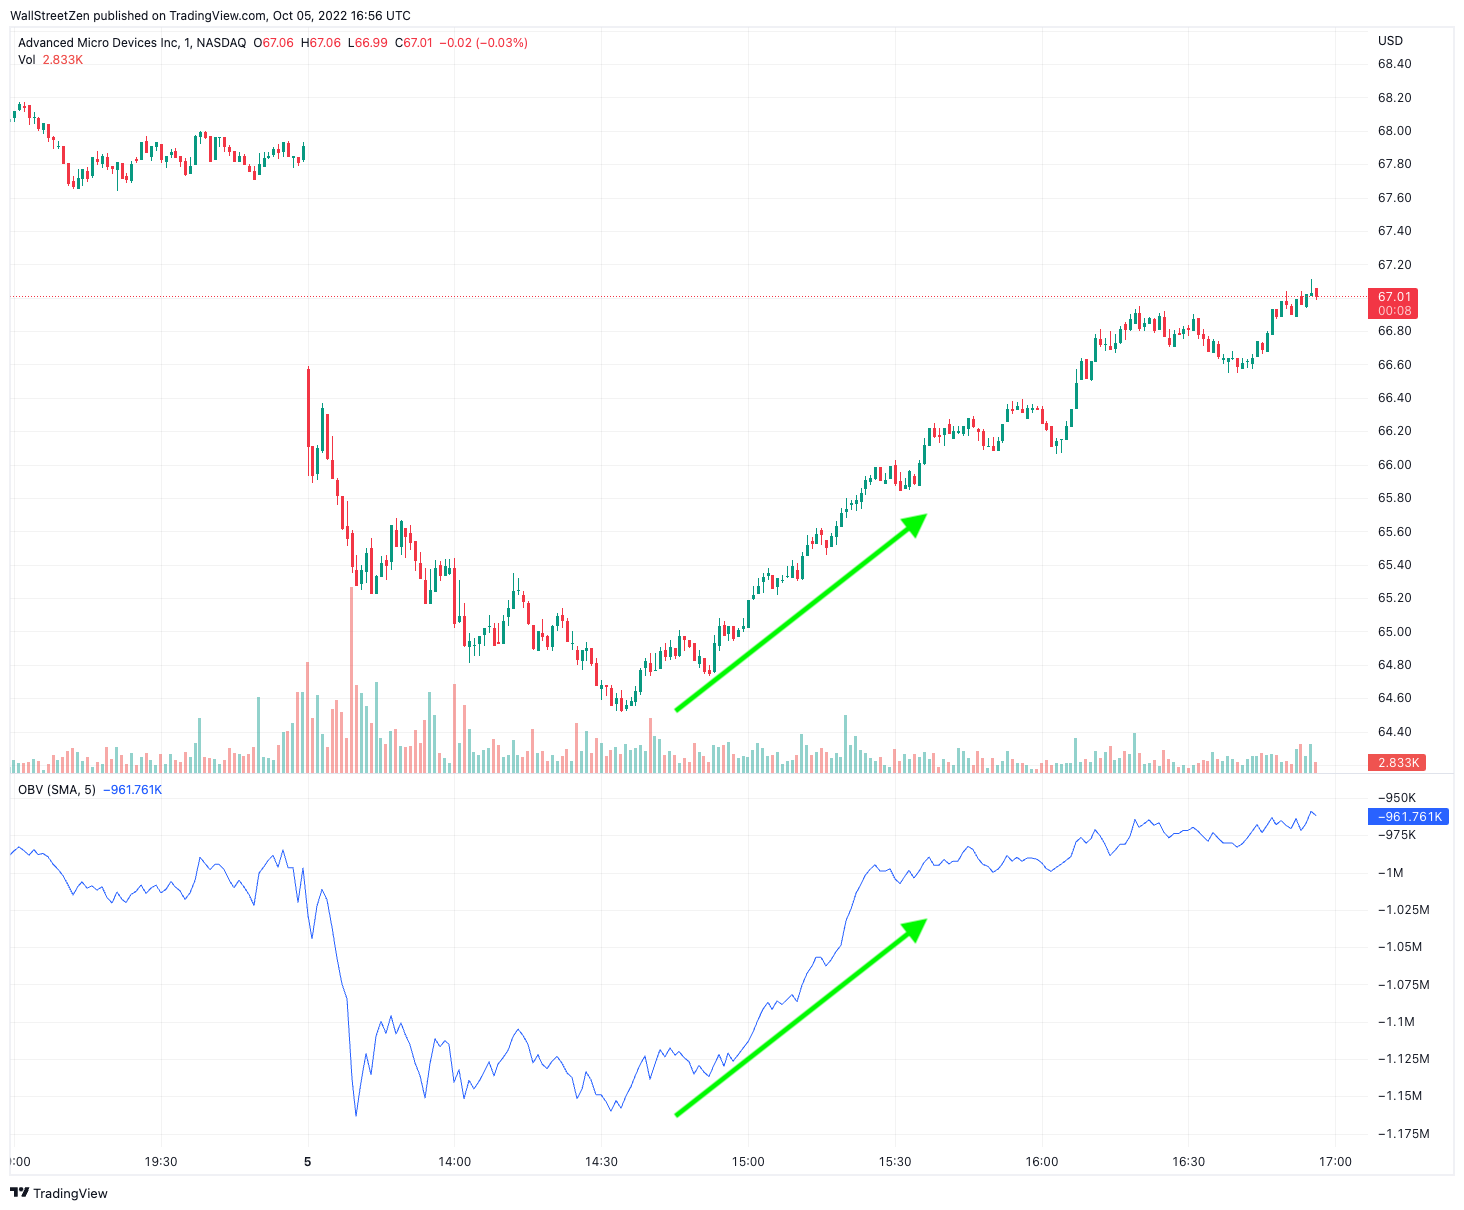
Similarly, if prices are falling and the OBV is making lower peaks and lower troughs, the down trend is likely to continue.
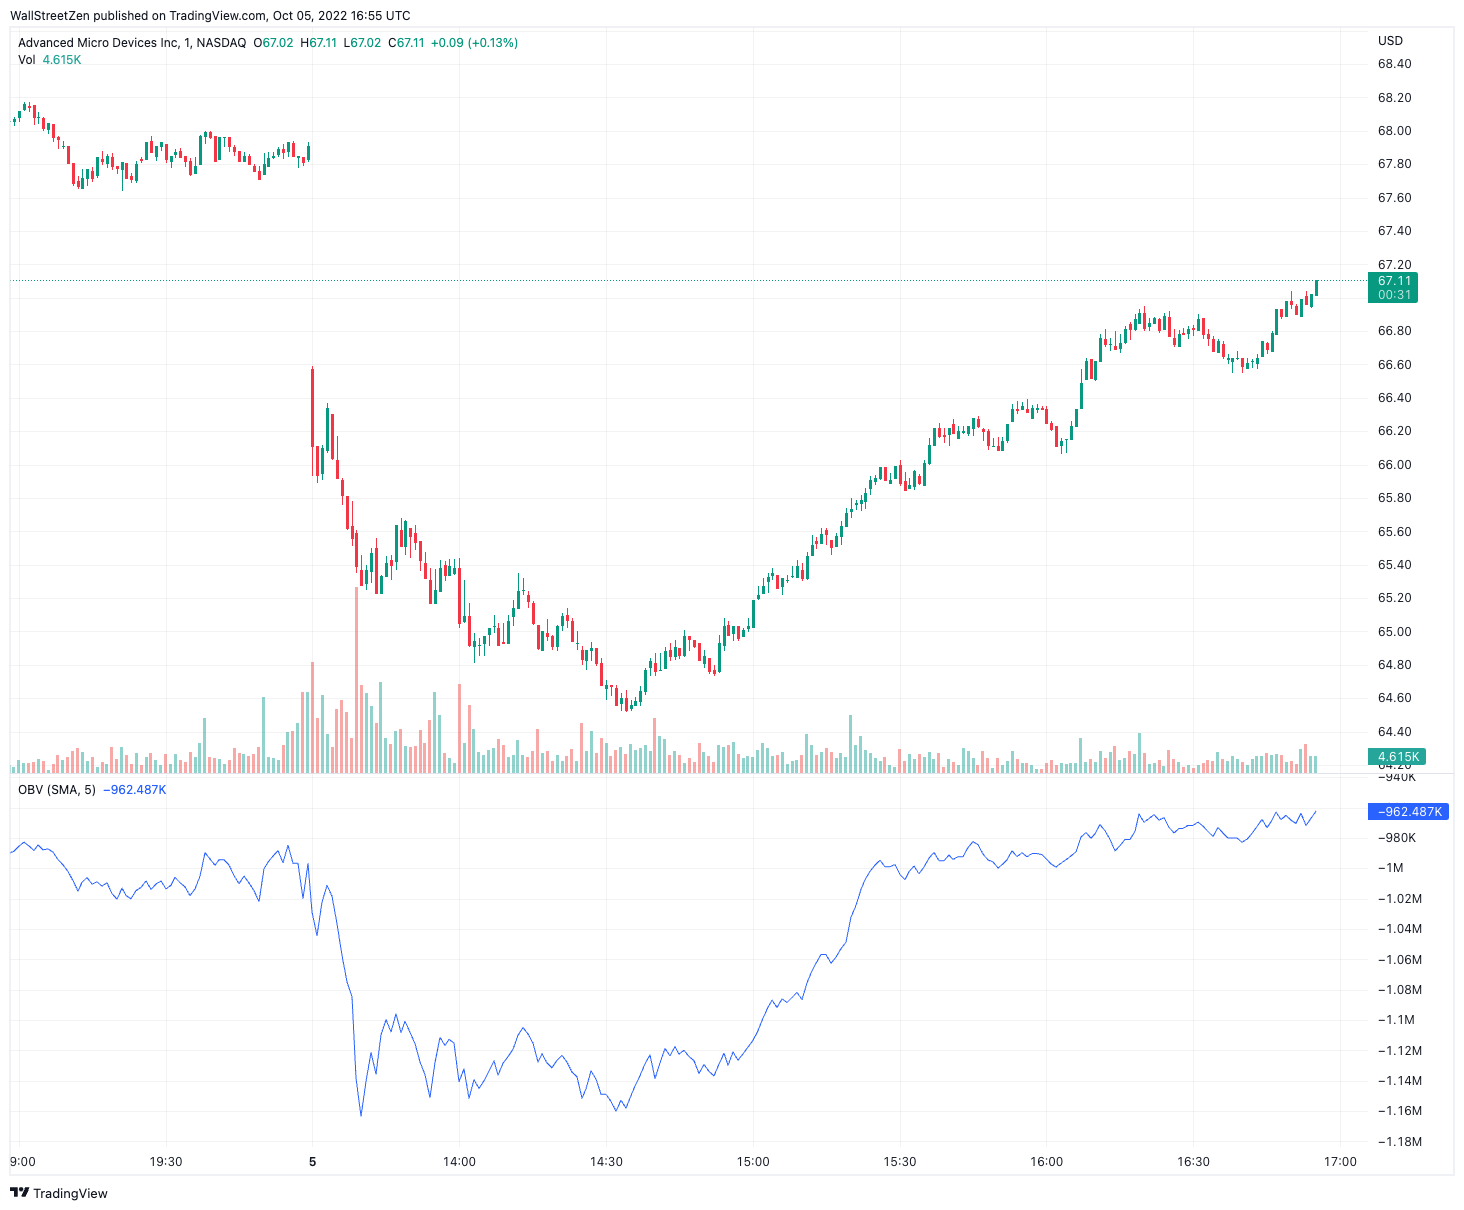
You can also look for divergence when the OBV is moving in the opposite direction of the stock price. If a stock is falling but the OBV is rising or staying flat (as in the image below), buyers are showing more conviction and there may be a price reversal soon:
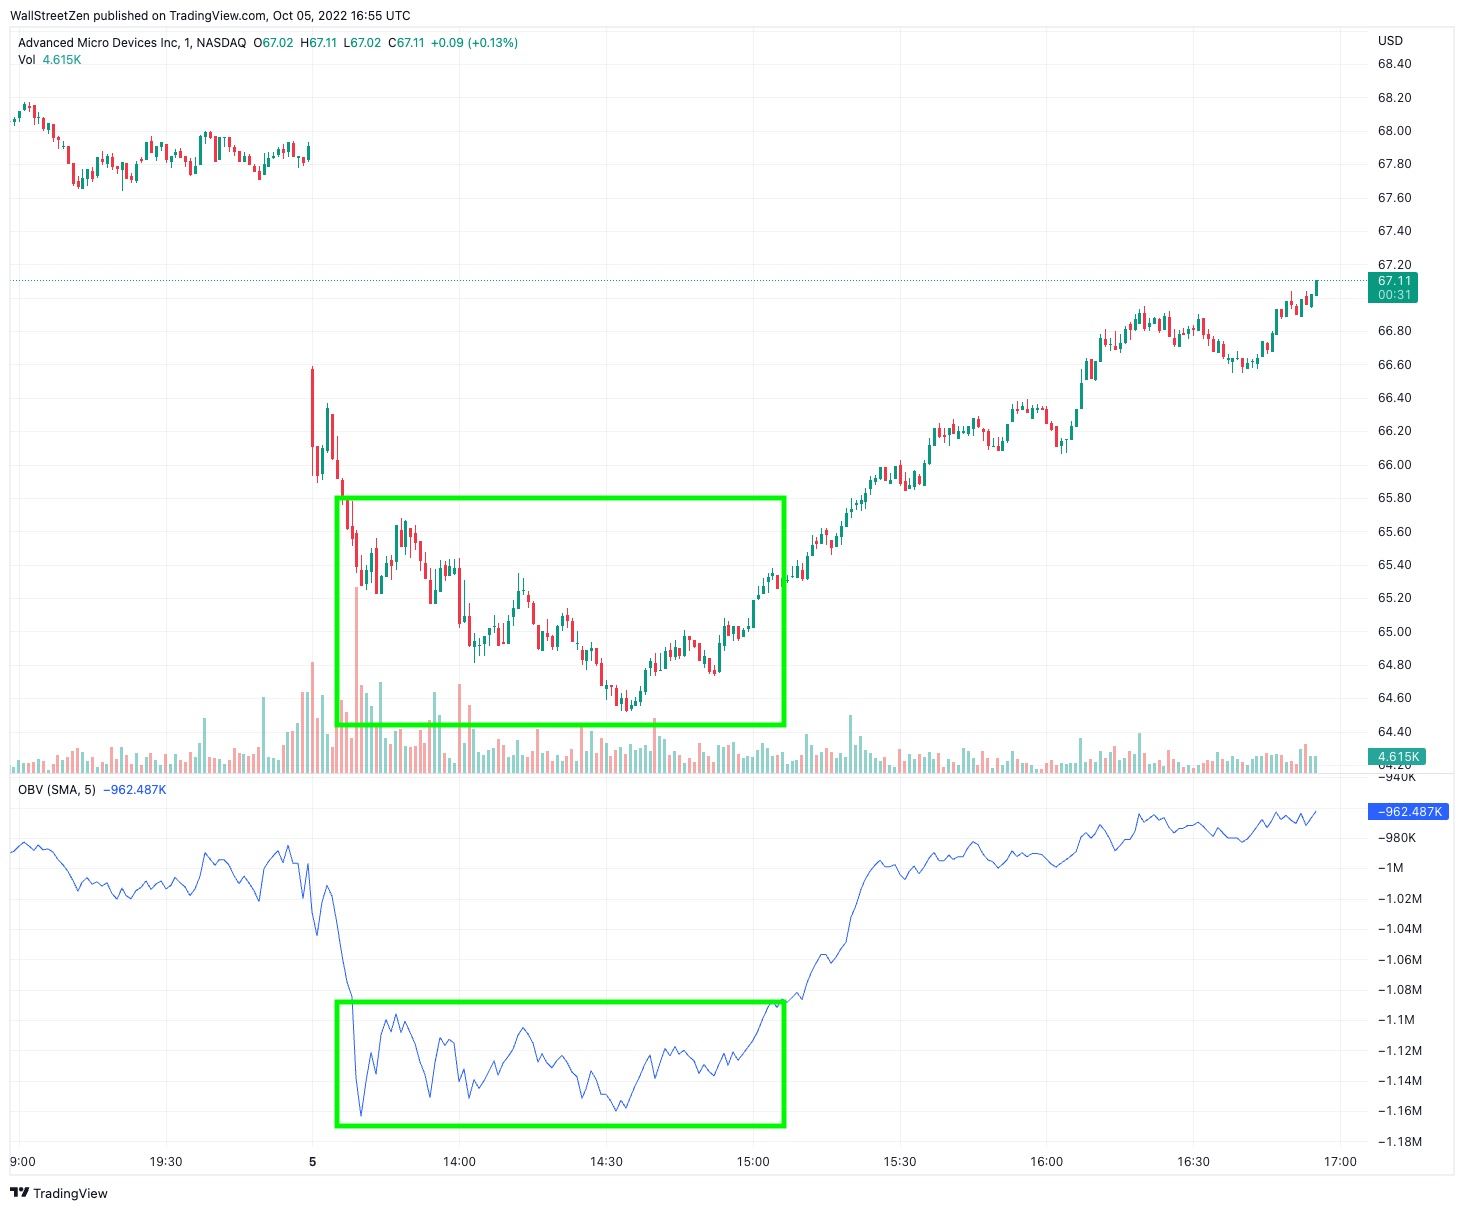
The opposite is also true.
If you like the look of these charts, be sure to check out TradingView. You can start a free 30-day trial with this link.
2. Money Flow Index (MFI)
The Money Flow Index (MFI) is an indicator which analyzes time, volume, and price to show buying and selling pressure:
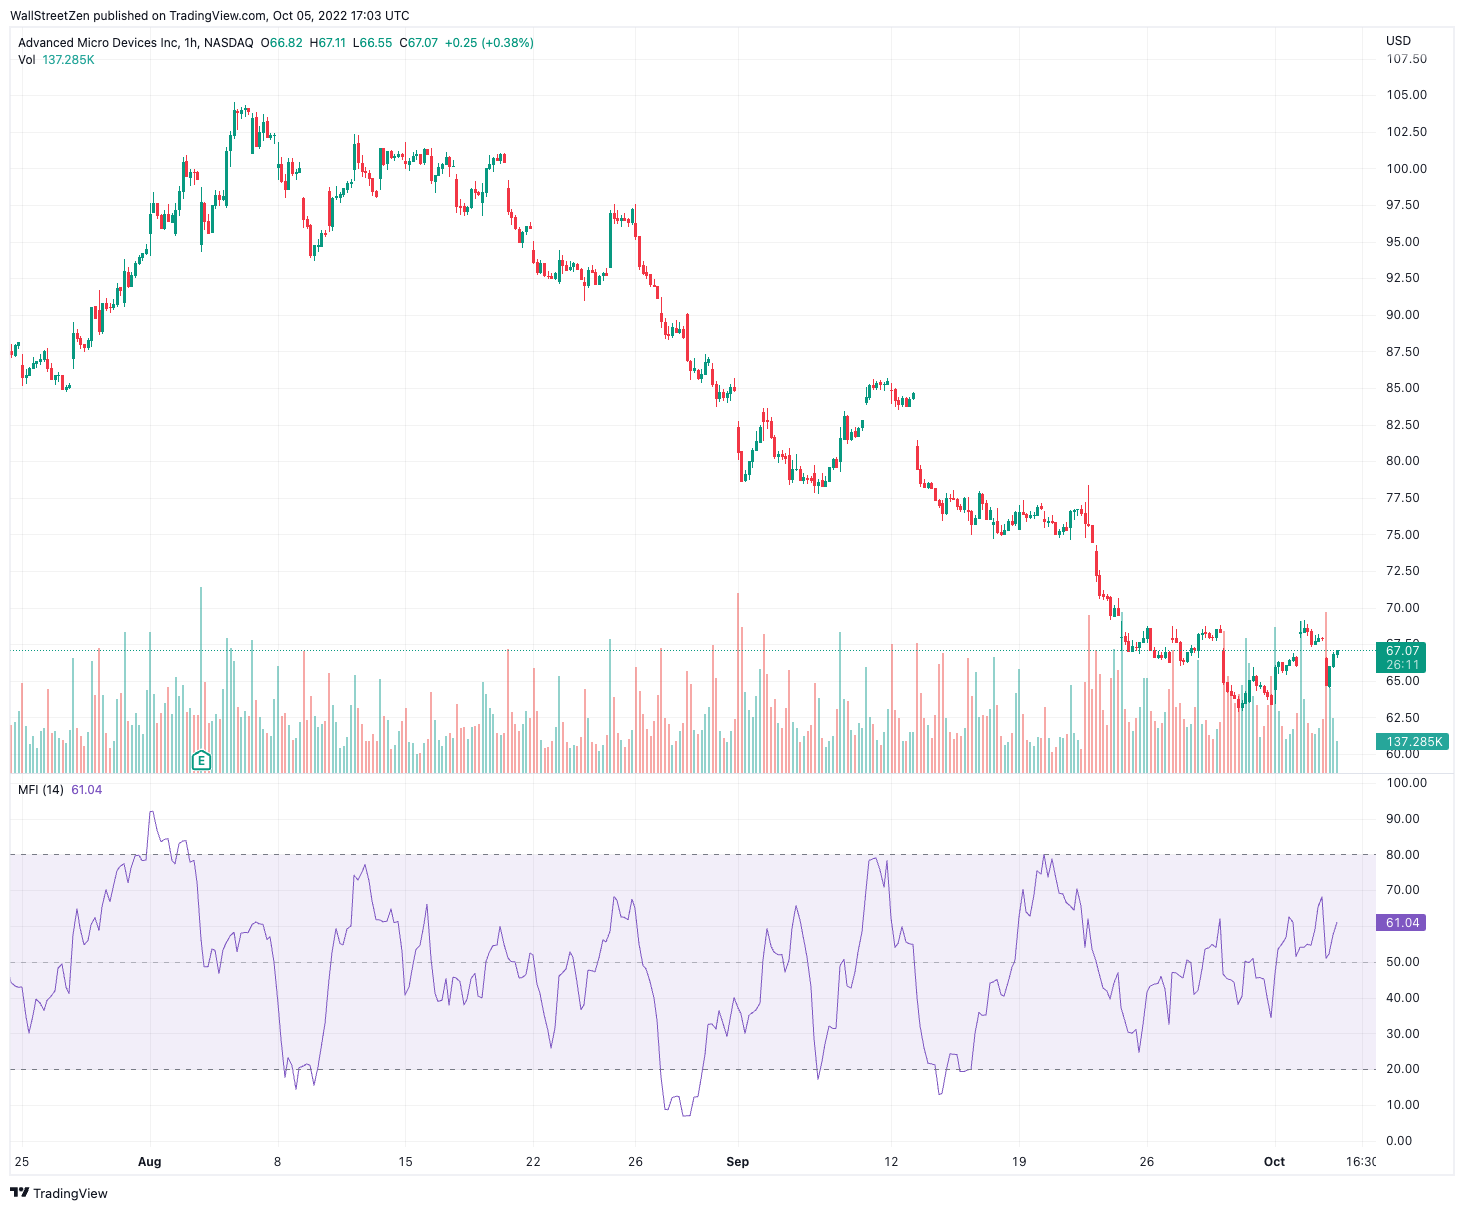
The MFI is a technical oscillator that identifies overbought or oversold areas. The MFI is also used to spot divergences (similar to the OBV).
The MFI’s overbought and oversold territories are used to signal potential entries. Since moves into these zones are rare, traders who use the MFI are fairly confident when they can take a trade based on one of these readings.
Here’s an example of AMD getting into overbought territory, signaling a chance to go short is imminent:
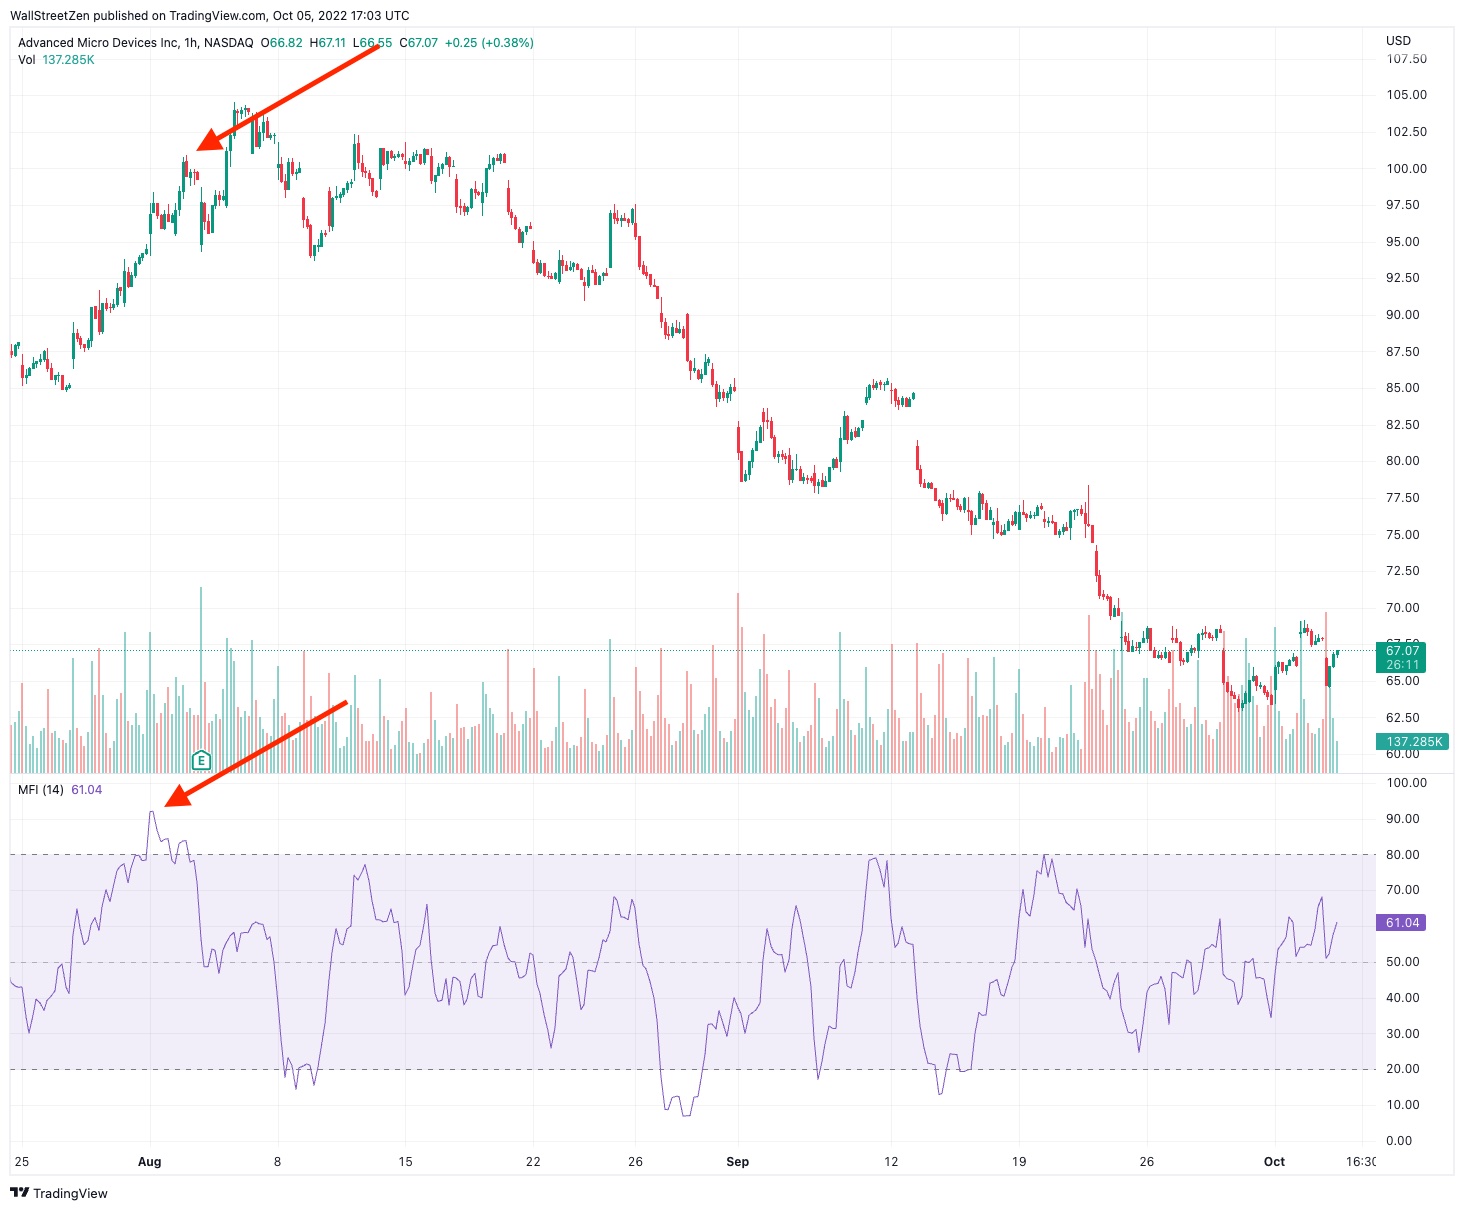
The MFI is very similar to the RSI, with the primary difference being the MFI incorporates volume, while the RSI does not. For this reason, the MFI is sometimes referred to as the volume-weighted RSI.
Want to see how trades work, not just in theory but in practice? The best way is to observe a trader at work. If you don’t happen to have a pro trader living next door, eToro’s CopyTrader is the next best thing.
With CopyTrader , you can see what real people are trading in real time, find and follow investors you like, and if you like, copy their trades with just a few clicks. Best of all, it’s commission-free!
eToro is a multi-asset platform which offers both investing in stocks and cryptoassets, as well as trading CFDs.
Please note that CFDs are complex instruments and come with a high risk of losing money rapidly due to leverage. 61% of retail investor accounts lose money when trading CFDs with this provider. You should consider whether you understand how CFDs work, and whether you can afford to take the high risk of losing your money.
This communication is intended for information and educational purposes only and should not be considered investment advice or investment recommendation. Past performance is not an indication of future results.
Copy Trading does not amount to investment advice. The value of your investments may go up or down. Your capital is at risk.
Crypto investments are risky and may not suit retail investors; you could lose your entire investment. Understand the risks here https://etoro.tw/3PI44nZ
Don’t invest unless you’re prepared to lose all the money you invest. This is a high-risk investment and you should not expect to be protected if something goes wrong. Take 2 mins to learn more
eToro USA LLC does not offer CFDs and makes no representation and assumes no liability as to the accuracy or completeness of the content of this publication, which has been prepared by our partner utilizing publicly available non-entity specific information about eToro.
3. Volume-Weighted Average Price (VWAP)
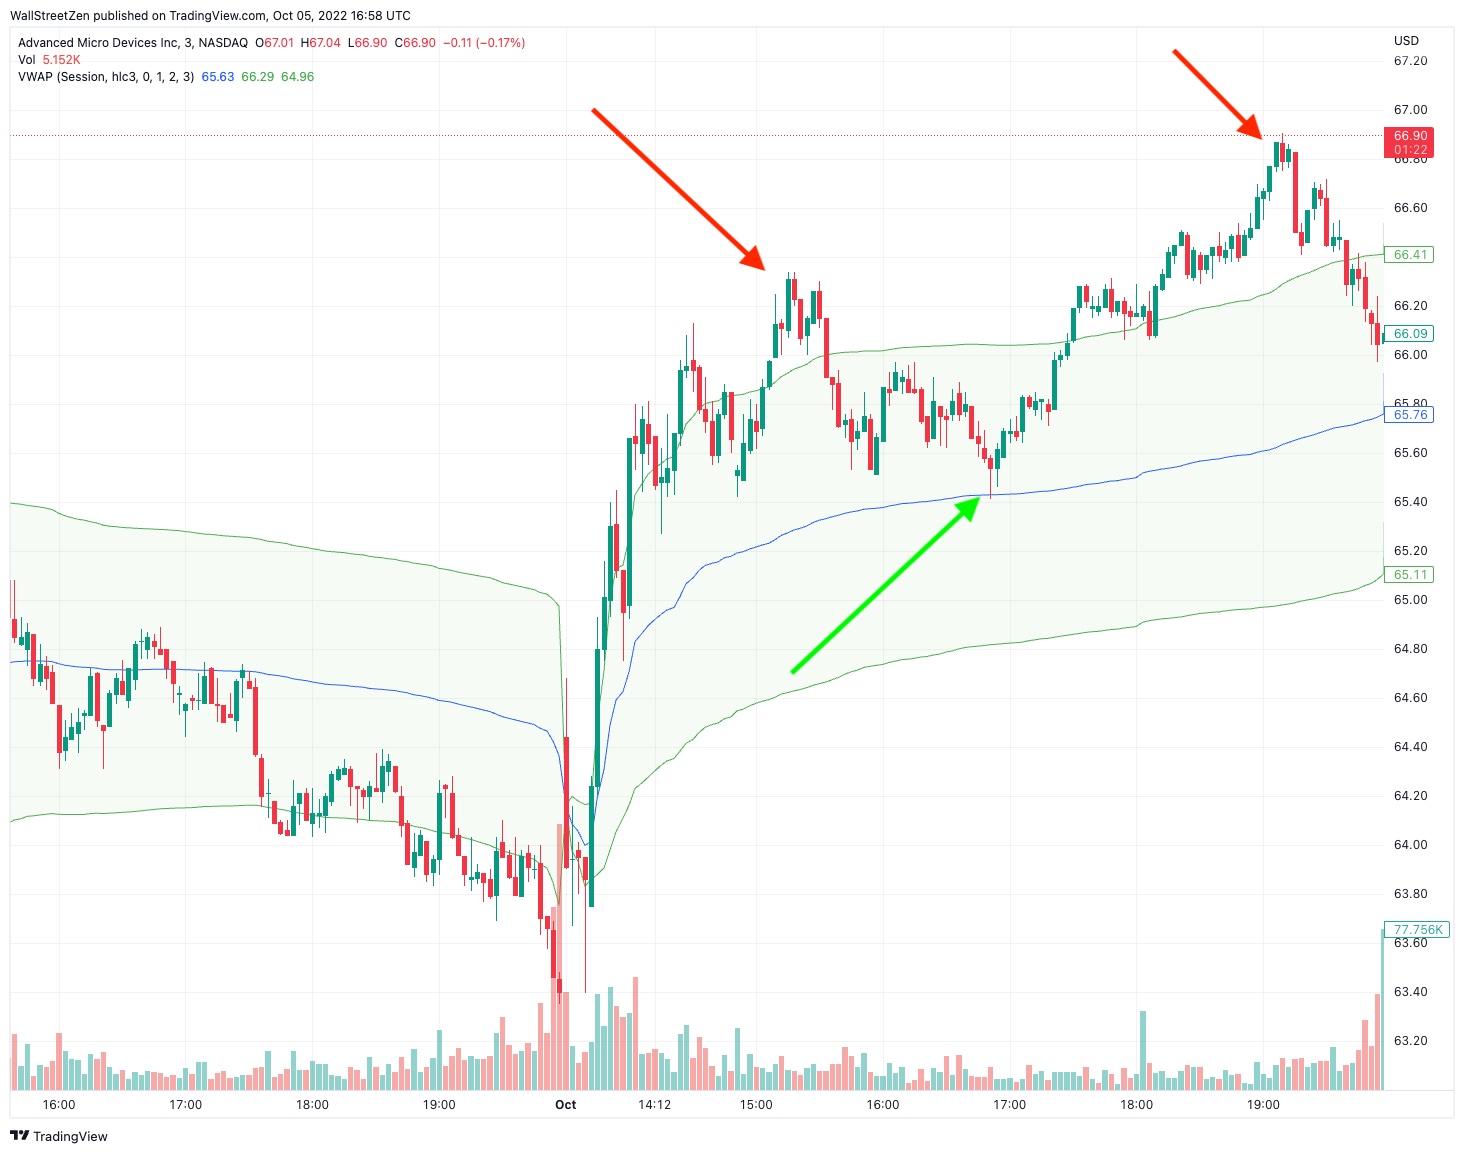
The Volume-Weighted Average Price (VWAP) is an indicator that shows the average price an asset has traded at throughout the trading session, taking both price and volume into consideration:

Unlike the other 3 indicators on this list, the VWAP is an overlay indicator used on intraday charts, and resets at the start of every new trading session.
Most traders use VWAP as a trend confirmation tool to help them visualize the trend in price action. If a stock’s price trends above the VWAP range, it may be time to go short:
Remember, if you like the look of these charts, be sure to check out TradingView.
You can start a free 30-day trial with this link.
If you do go short, be sure to watch out for a bounce around the primary volume support.
Some institutions use the VWAP to move into or out of stocks while making as small of a market impact as possible. When possible, they will buy shares below the VWAP or sell above it. This way, their buying and selling pushes the price back toward the current average.
4. Accumulation/Distribution Line (Accum./Dist.)
The Accumulation/Distribution Line is an indicator that measures the cumulative flow of money into and out of a stock:
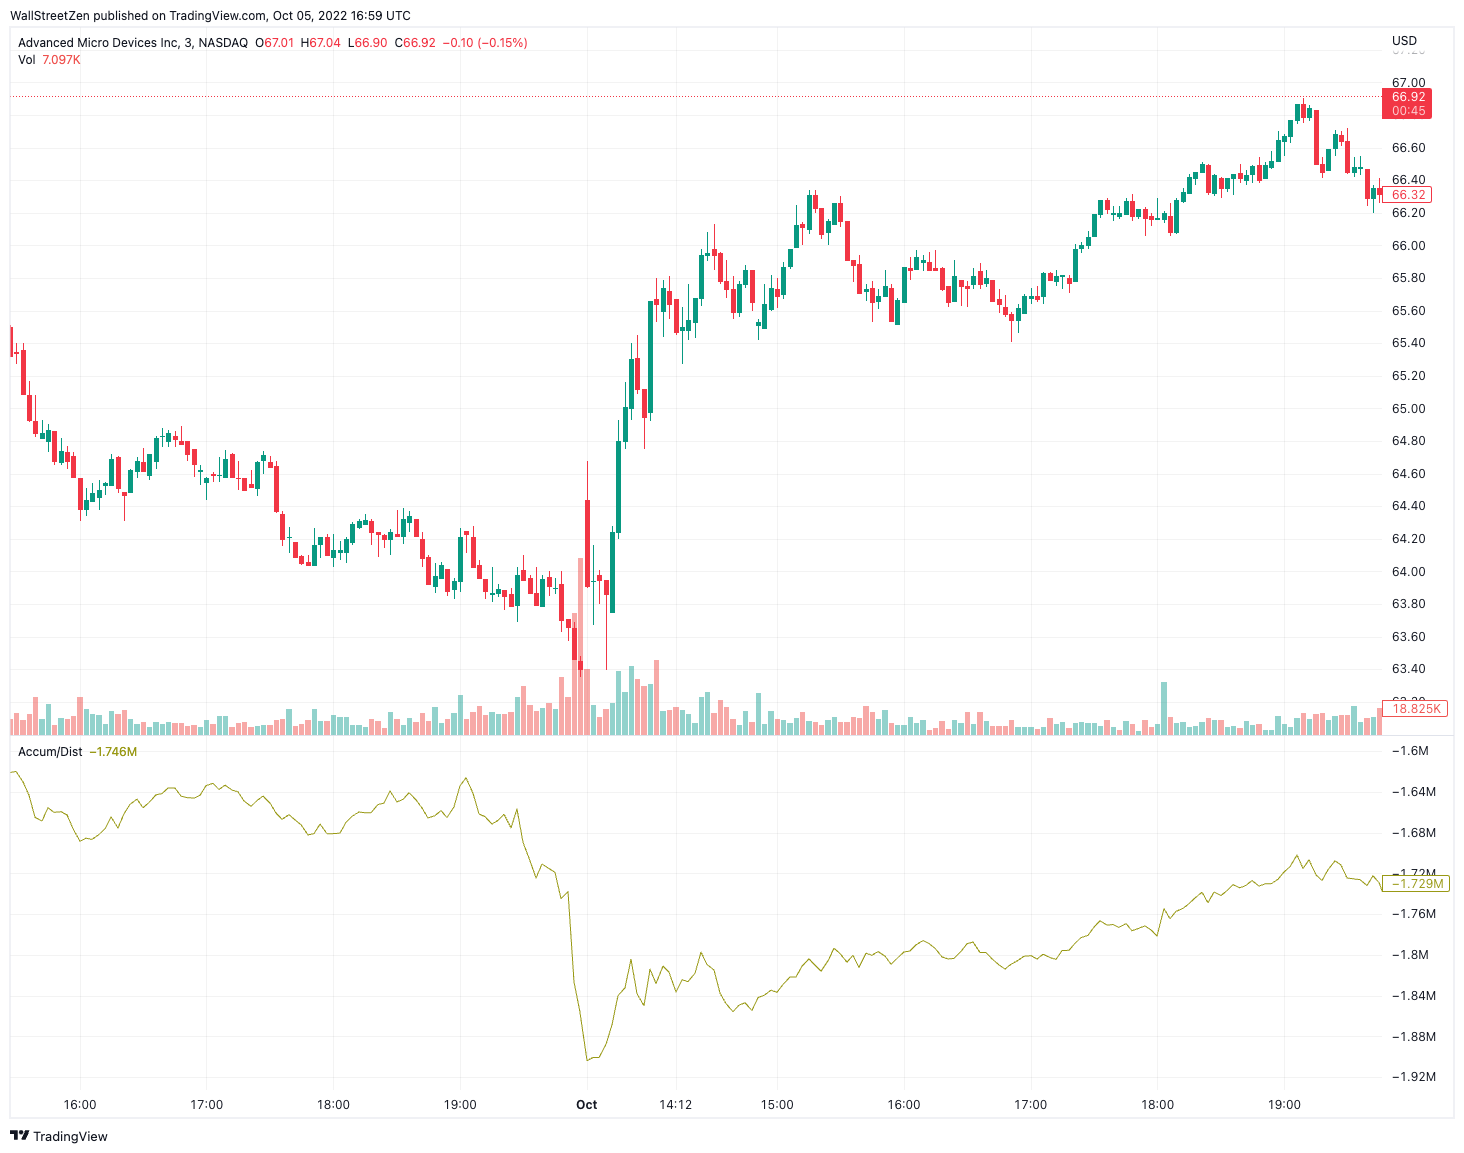
The Accum/Dist line detects positive or negative divergences in price and volume data which can signal future price movements.
For example, if a stock is trending higher but there is more money flowing out of than into the stock, there may be a negative move coming:
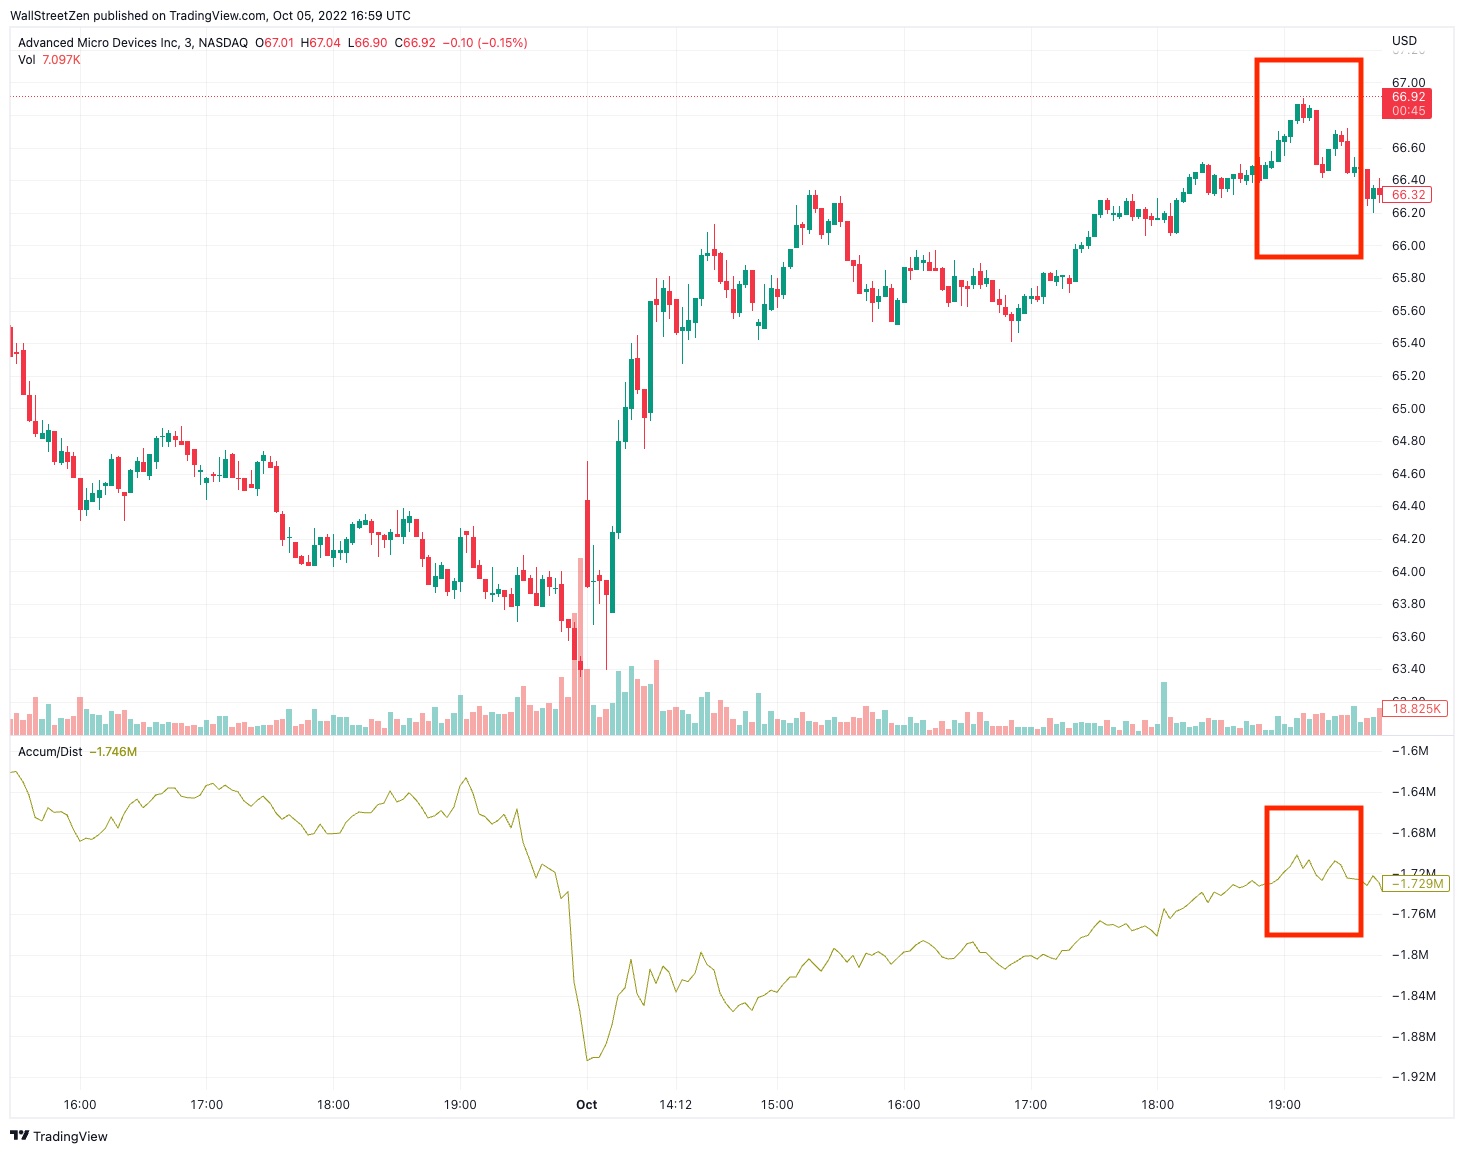
The Accumulation/Distribution indicator shows the trend of supply and demand, which is the real driver of stock price movement.
All 4 of these volume indicators are available on TradingView.
What is Volume?
Volume is a measure of how much a specific asset has traded in a set period of time.
In stock investing, volume is measured by the number of shares traded. Every time you buy or sell a stock, you’re adding to that stock’s daily volume.
Why is Volume Important in Trading?
Traders use volume to determine liquidity and to make trading decisions.
Let’s say you own 100 shares of AAPL. Which one is a trade with greater conviction: You selling all 100 shares or you selling 10 shares? Obviously, if you sold all 100 shares you would feel more strongly than if you sold just 10 shares.
This, iterated across millions of investors, is the basic principle behind analyzing trading volume.
Analyzing volume can help a trader understand the strength behind specific stock price movements. The greater the volume, the more conviction behind the movement.
Because of this, volume plays a central role in nearly every trading strategy, and there have been countless volume indicators created to help traders interpret volume data.
Day traders aim to join strong moves and avoid moves that show signs of weakness (or look for an entry in the opposite direction of a weak move).
Why Use Volume Indicators?
Volume is a critical component of successful day trading, but it can be hard to interpret. After all, for every buy and sell, there’s another investor on the opposite side of that trade who has an opposing viewpoint. This creates a lot of noise.
Volume indicators were created to cut through that noise and visually display the interplay between price action and volume. These indicators make it easier for traders to make buy and sell decisions quickly, objectively, and profitably.
Which is the Best Volume Indicator?
While no single indicator is right 100% of the time, the best volume indicator for you is the one that helps you reliably find quality entry and exit points.
Almost every successful day trader has a system they’re confident in, and most (if not all) of those systems incorporate a volume indicator of some sort.
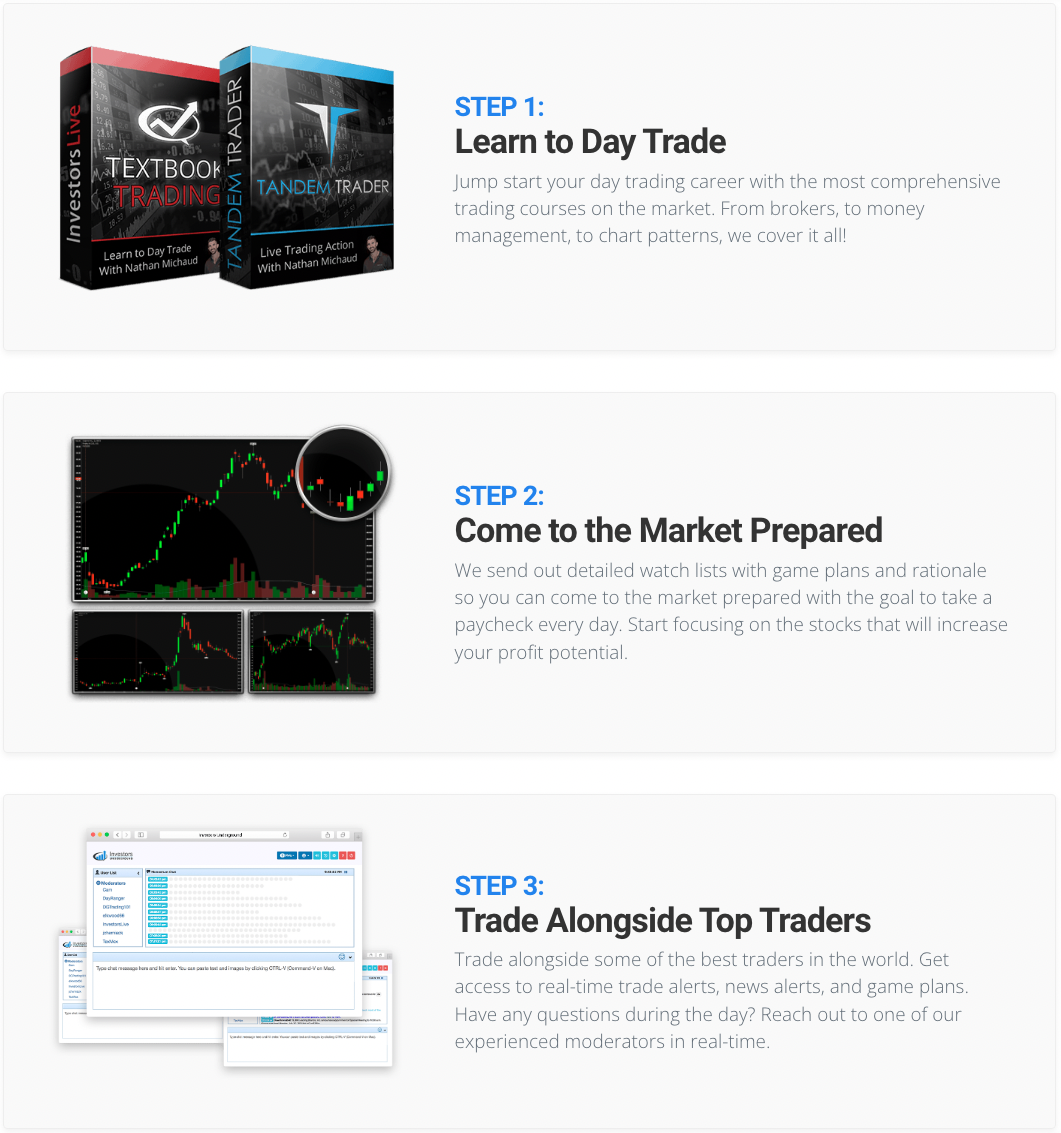
The Best Place to Learn Day Trading
Investors Underground is the best community and has the best educational curriculum to learn day trading.
Nathan Michaud is a world-class trader and founded IU in 2004. Since then, his company has turned into a juggernaut in day trading courses, communities, and other resources.
Here’s the reality: If you want to become a day trader, you’re going to need to invest money in either a course or 6+ months of trading losses.
Day trading is one of the most challenging ways to make money in the world. You’re trading against some of the smartest people on the planet – people who are smarter and more experienced than you.
It’s no wonder that the vast majority of new traders lose money (usually a lot of money).
You can avoid the pain of learning on your own (which is very expensive) and learn directly from a trader who has turned hundreds of brand-new traders into money-making machines.
I always recommend starting with their Monthly subscription. Then, if you like what you see, consider adding the course bundle. It’s expensive, but it’s worth it.
Save yourself money and shortcut your path to trading success:
FAQs:
What is the best indicator for volume?
The best indicator for volume is On-Balance Volume (OBV).
Which indicator is most reliable?
Volume indicators are the most reliable type of indicator.
My favorite volume indicator is OBV, but the MFI gets a lot of attention. You should try both and choose which one best suits your trading style.
Is volume profile a good indicator?
Yes, the volume profile is an excellent indicator.
The volume profile would easily be in the #5 spot on this list of the best volume indicators if I were to add another recommendation.
Where to Invest $1,000 Right Now?
Did you know that stocks rated as "Buy" by the Top Analysts in WallStreetZen's database beat the S&P500 by 98.4% last year?
Our May report reveals the 3 "Strong Buy" stocks that market-beating analysts predict will outperform over the next year.