Mijusko Sibalic is a content writer and copywriter that wandered into the financial space from a background in political science. Ever since then, his professional sights have been set on the same goal - communicating important topics regarding investing and the journey to financial independence to the wider public.
Jessie Moore has been writing professionally for nearly two decades; for the past seven years, she's focused on writing, ghostwriting, and editing in the finance space. She is a Today Show and Publisher's Weekly-featured author who has written or ghostwritten 10+ books on a wide variety of topics, ranging from day trading to unicorns to plant care.
Our editorial team uses a strict editorial review process to compile all reviews, research, and evaluations of any kind. Our company, WallStreetZen Limited, is supported by our user community and may receive a small commission when purchases are made through partner links. Commissions do not affect the opinions or evaluations of our editorial team.
Swing trading may not require the commitment of long-term investing, but you still need to have conviction in your decisions.
Need a confidence boost?
Cue technical indicators — handy tools that summarize and visualize various relevant data points. Used in tandem with stock chart patterns, technical indicators can help give you an edge in trading that can help you make more informed and confident trading decisions.
But what are the best stock indicators? In this article, I’ll share what I consider the best technical indicators for swing trading — ranging from the best indicator for trading trends to indicators for identifying trends and reversals, and much more.
Find market-beating stocks before they explode…
With a Zen Investor subscription, you can save precious research time and let a 40+ year market veteran do the heavy lifting for you. Here’s what you get for just $99 ($79 for a limited time, using links in this post):
✅ Portfolio of up to 30 of the best stocks for the long haul, hand-selected by Steve Reitmeister, former editor-in-chief of Zacks.com with a 4-step process using WallStreetZen tools
✅ Monthly Commentary & Portfolio Updates
✅ Sell Alerts if the thesis changes
✅ Members Only Webinars
✅ 24/7 access to all the elements noted above
✅ Access to an archive of past trades and commentary.
Below, I’ve detailed everything you need to know about the best technical indicators for swing trading, complete with charts from our top charting platform, TradingView…
1. Moving Averages
Moving averages are some of the simplest and best swing trading indicators. Their purpose is to paint a clear picture of the trend of a security by smoothing out price action.
There are 2 main types of moving averages:
Simple Moving Averages (SMA)
Exponential Moving Averages (EMA)
Simple moving averages are calculated by taking the closing prices in a specific timeframe and dividing that by the number of periods to give you the average price for a given period.
It’s considered a lagging indicator because all the closing prices, regardless of whether or not they are recent, are weighted equally.
(Exponential moving averages try to fix this issue by giving more weight to recent closing prices, but it’s still a lagging indicator.)
Taken on its own, any moving average is only good enough to confirm trends — not predict them. So how can you use it?
Moving average crossovers can provide helpful information on entry and exit points.
The method is quite simple. Whenever a shorter-term moving average goes above the longer-term moving average, that’s a bullish crossover, indicating a good potential entry position.
Conversely, when a shorter-term moving average drifts below the longer-term moving average, that’s quite a bullish sign, and usually, a good time to close a position.
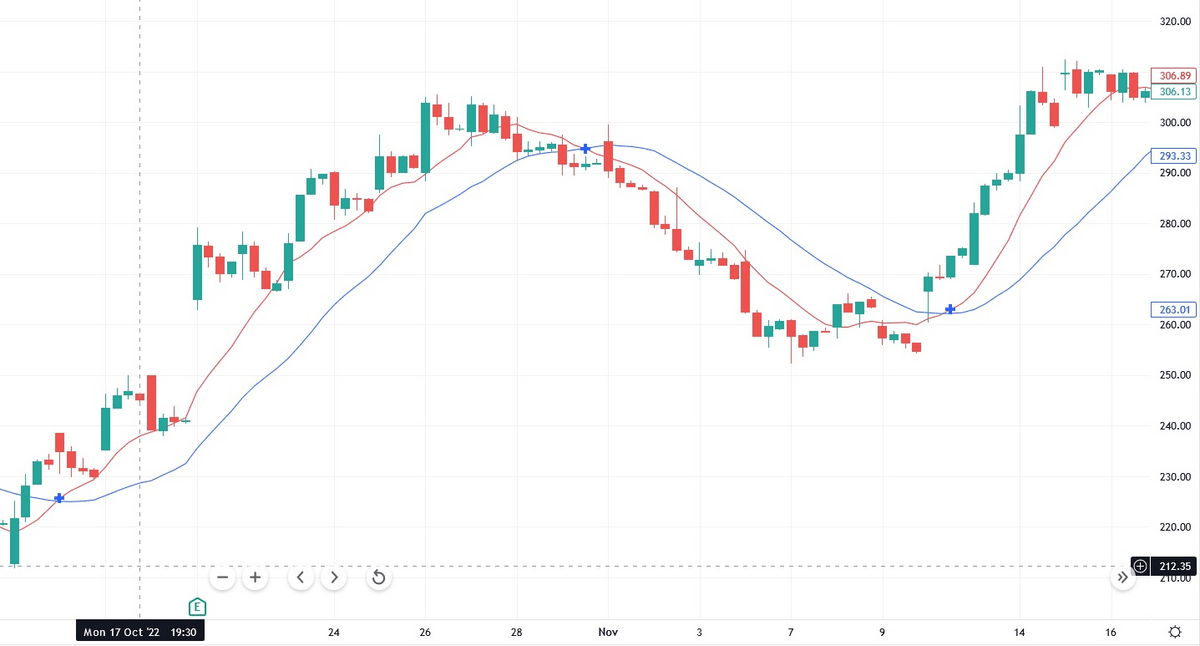
In the screenshot above, the red line represents a short, 9-day moving average, while the blue line represents a long, 21-day moving average of AMD.
There are three crossovers:
The first is bullish (short over long)
The second is second bearish (long over short)
The third is bullish again
While many investors use the 50-day, 100-day, or 200-day time frames, some swing traders prefer to use the following time frame combinations to identify actionable crossovers:
9 days / 21 days
10 days / 30 days
13 days / 48 days
20 days / 50 days
2. Volume
Volume is a measure of liquidity. It represents how many shares or other units of an asset were traded during a specific timeframe.
There’s a reason why so many traders consider volume one of the best stock indicators. An asset that shows strong trading volume can easily be sold, making it easy to exit positions. Trading any asset that doesn’t have a decent level of volume should be avoided.
One simple yet effective way to use volume to gauge price movements is by contrasting it with price movement. There are four possible combinations here:
Upward price movement, high volume: Strong bullish signal
Upward price movement, low volume: Suggests the upward trend is losing steam + could reverse
Downward price movement, high volume: Strong bearish signal
Downward price movement, low volume: Bearish sentiment is weakening; a reversal into an uptrend might take hold.
Volume Indicator: Example
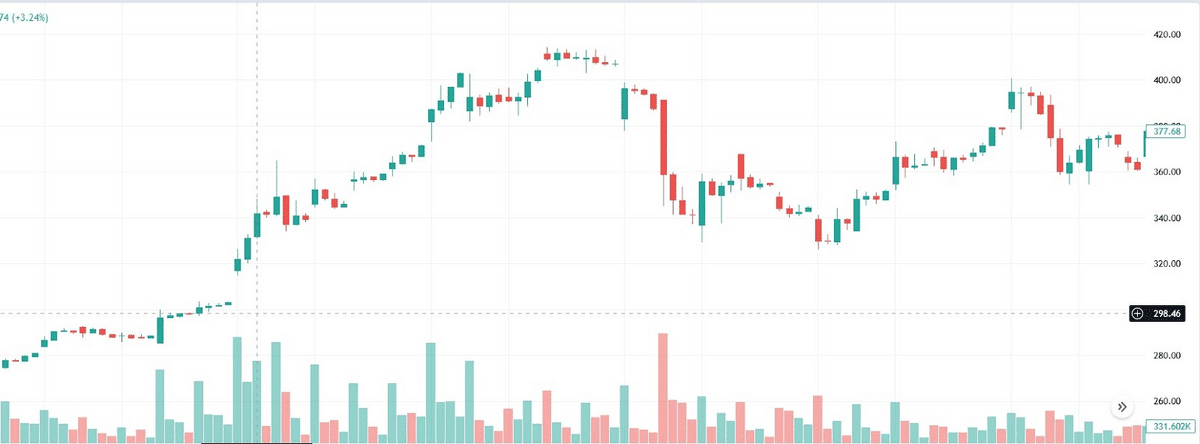
Here’s how volume looks on a chart. The upper portion consists of traditional Japanese candlesticks, representing the price movements in Tesla (NASDAQ: TSLA), while the lower charts represent volume levels.
Note how the biggest drop in the chart is followed by rapidly dropping volume — a sign that the downward swing isn’t backed up by long-term selling pressure.
Tips:
Be mindful of sudden spikes in volume. These are usually the result of important events and are often followed by significant price moves or mark the beginning of trends.
This indicator is less reliable during pre- and post-market trading, which experiences lower volume overall.
Analyzing volume is a critical component of successfully using stock chart patterns. In general, high volume is used to confirm breakouts.
Volume is also a component of several more complicated technical indicators — we’ll be covering one of them, on-balance volume (OBV) in just a little bit.
Want to level up your trading in a hurry?
Investors Underground has the best trading courses and community around. They’ve turned thousands of beginners into full-time traders.
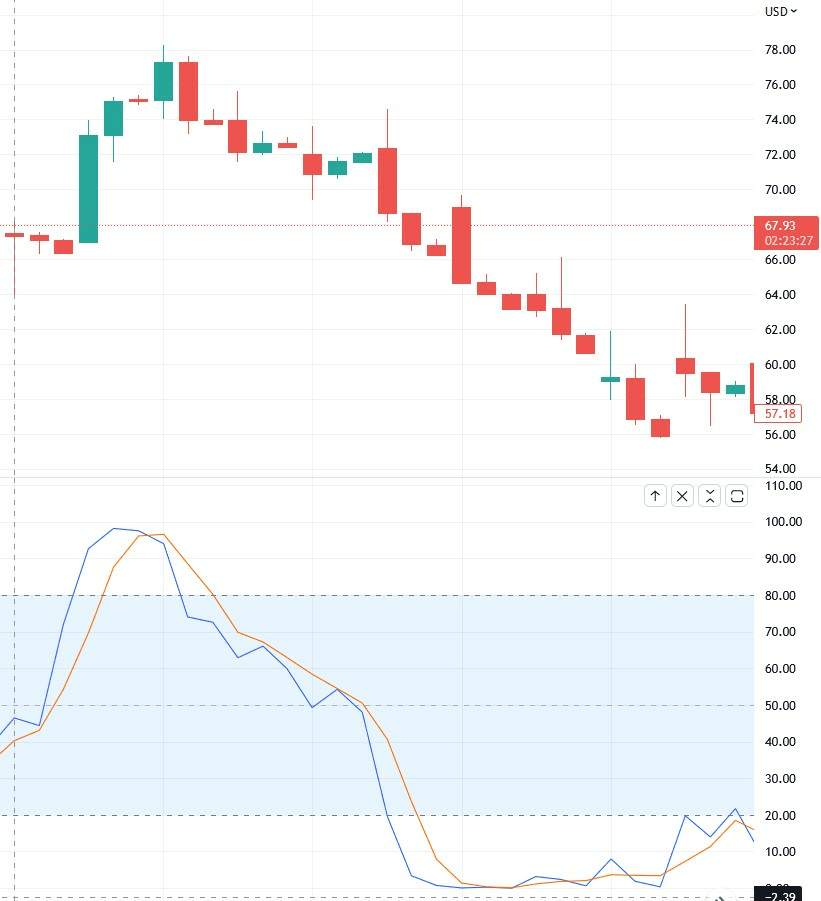
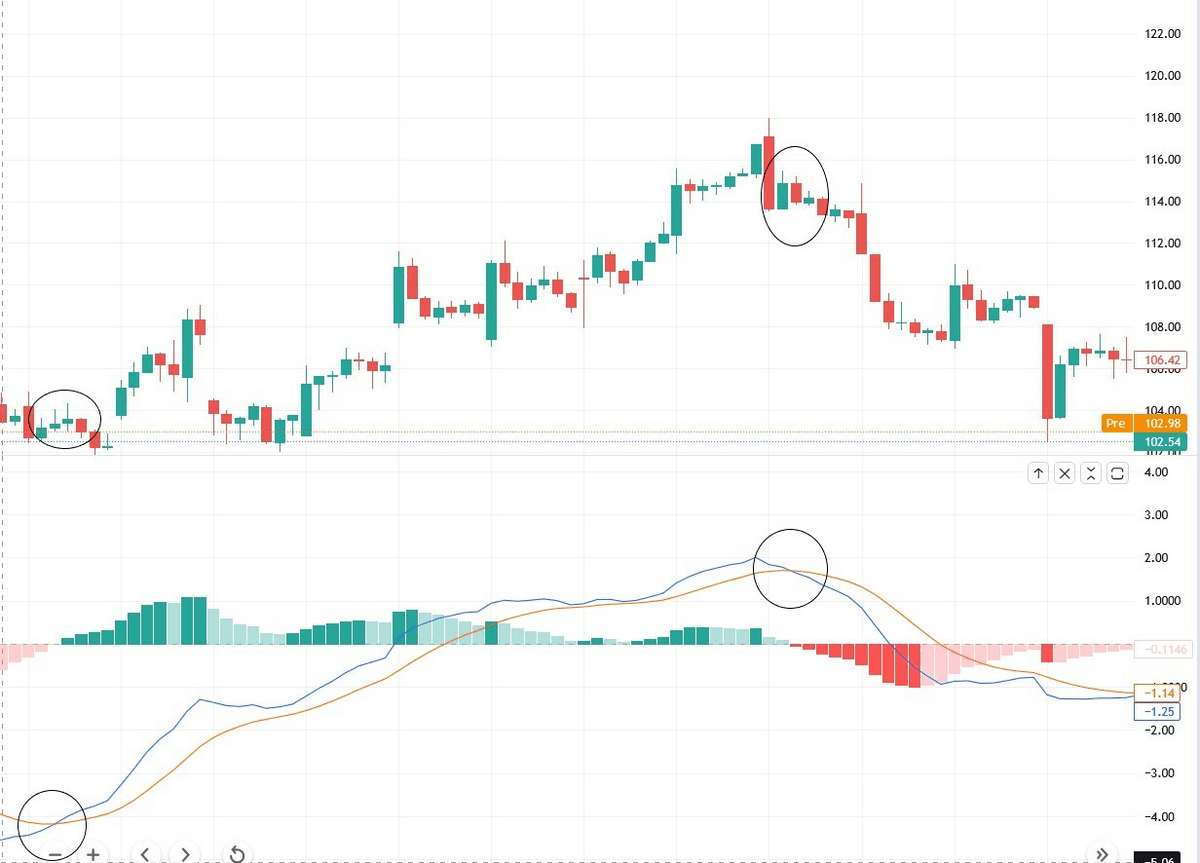
Relative Strength Index (RSI) is a momentum indicator that measures two things: how quick and how drastic price movements are.
The value of the RSI can be anything from 0 to 100, so it’s quite straightforward and easy to understand:
RSI values in excess of 70 indicate that a security is overbought.
RSI values under 30 suggest that a security is oversold.
Any time that a security is overbought or oversold, the odds of a pullback or a correction are heightened. Spotting those corrections ahead of time can help improve your potential to profit.
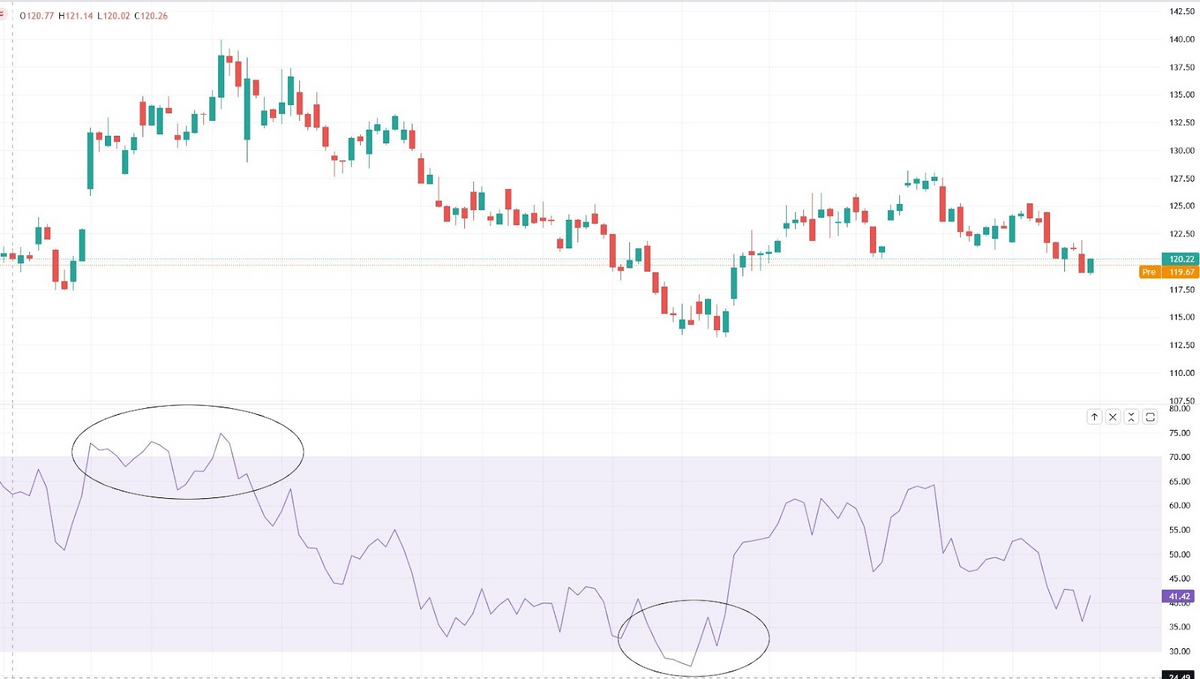
In the chart above, you can see the RSI indicator on a chart where Qualcomm (NASDAQ: QCOM) is overbought, with RSI values slightly above 70 — a bit later, it is oversold.
Corrections occur in both cases, with stock price initially dropping by more than $10, and subsequently rising by more than $10 when the indicator wades into overbought and oversold territory.
This initial correction takes place over a month; the upswing after the stock is oversold takes place over two weeks. This places it firmly in the swing trading category.
While it wouldn’t be wise to buy or sell just because the values reached 70 or under 30, RSI is just one more indicator to help strengthen your conviction.
Also worth noting? Divergence. That refers to any situation where the RSI and the actual price action of a security go their separate routes.
A security’s price reaching higher highs while RSI simultaneously reaches lower highs is a case of bearish divergence. It’s a sign that the present bullish trend might be headed for a reversal.
A security experiencing lower lows while its RSI is reaching higher lows is a case of bullish divergence. This indicates that the present downward trend is losing steam and that the bulls might soon take control. Check it out in the below chart:
RSI and RSI divergence are at their most useful when the market is in a trend. If the market is experiencing sideways trading (meaning there is no clear trend), the indicator becomes much less reliable.
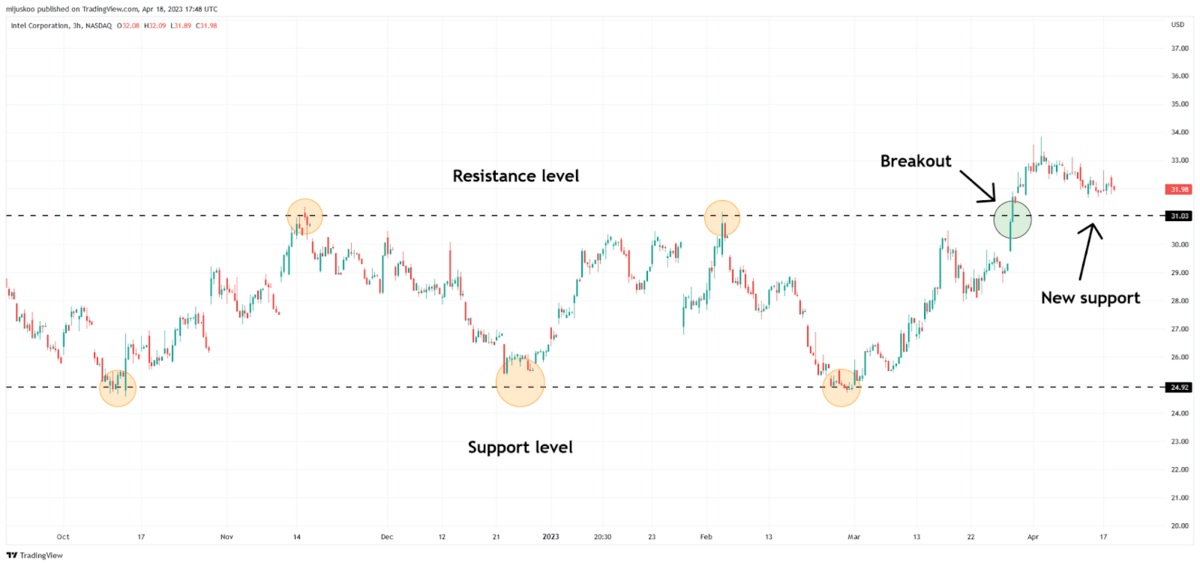
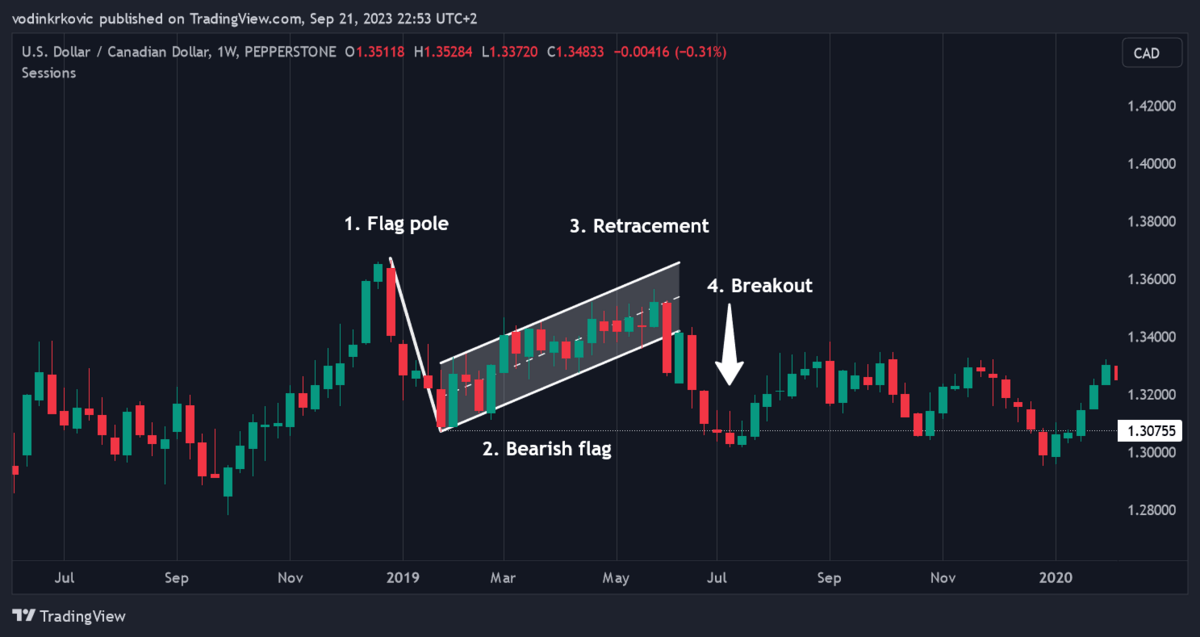
4. Support & Resistance
Support and resistance are the cornerstone of technical analysis, and serve as a great shorthand for supply and demand.
This simple technical indicator consists of two lines:
The support line represents the price point below which a security is unlikely to drop.
The resistance line represents the price point above which a security struggles to rise above.
Support and resistance can be broken by price action. This is often, but not always, the mark of a new trend taking hold. Once support or resistance is breached, the price often retreats back between the two lines.
However, if the price action is sustained, and moves away from the lines on strong volume, you’ve most likely got a new trend on your hands.
Once a breakout occurs, the previous resistance line can sometimes become the new support line and vice versa in a process known as role reversal.
Support and Resistance Indicators: Example
In the chart above, Intel (NASDAQ: INTC) is range-bound for six months. Although the price reaches support and resistance several times, no breakout occurs.
Only when the price confidently surpasses the line of resistance in late March does the price move even further upward without retreating — a sign that role reversal might have occurred, as well as the beginning of a new uptrend.
Stock Market Guides helps traders find specific stock setups with a backtested edge by pairing technical signals with historical performance data. Each scan shows how similar setups have performed in the past, making it easier to filter for high-probability trades with confidence.
eToro is a multi-asset investment platform. The value of your investments may go up or down. Your capital is at risk.
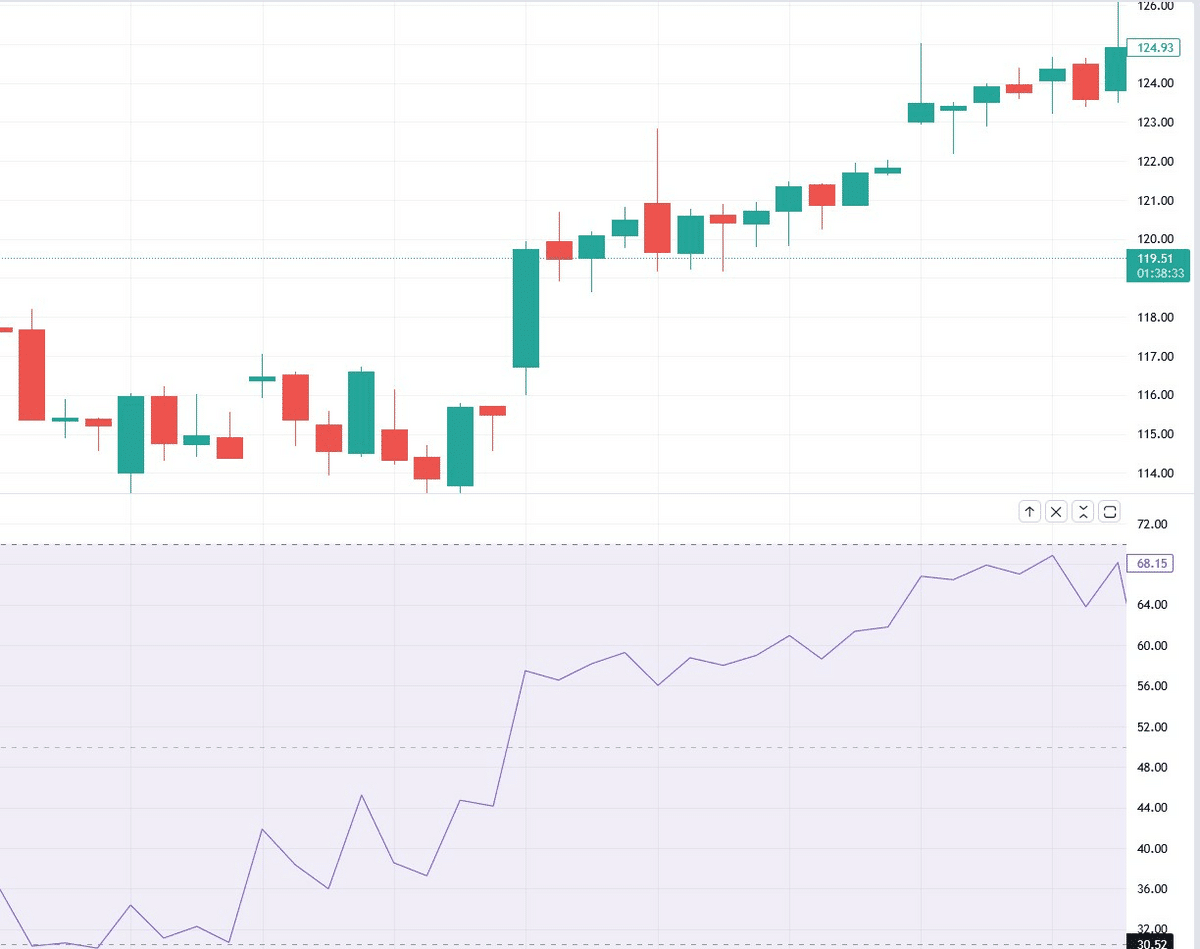
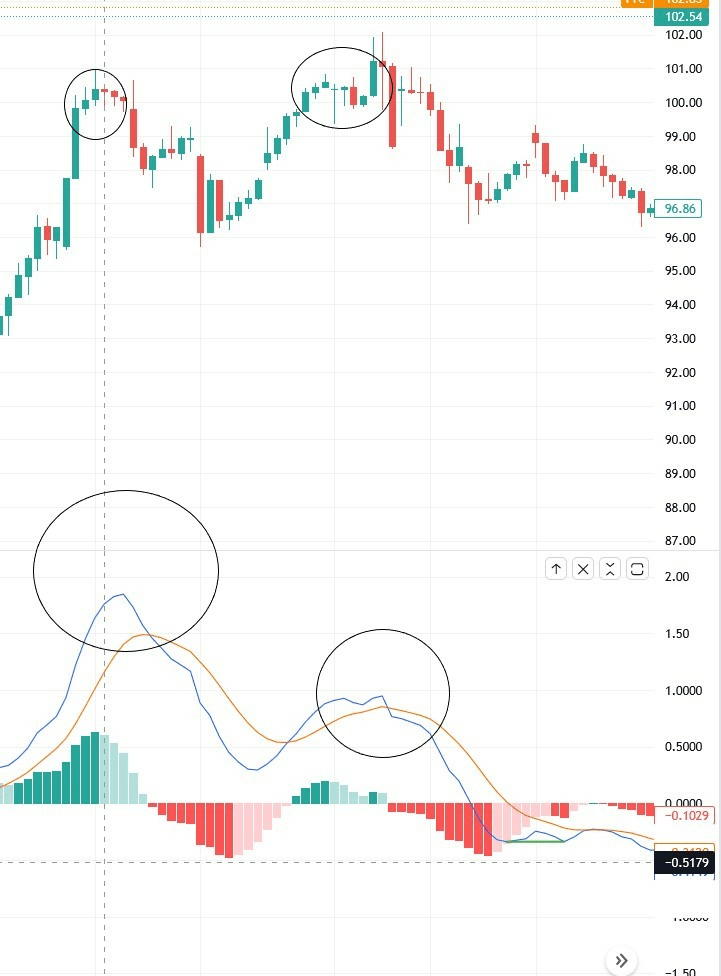
5. Stochastic Oscillator
Next on our list of best swing trading indicators? The stochastic oscillator, which is used to determine if a security is overbought or oversold by comparing the closing price of a security with the security’s price range during a chosen time frame.
The stochastic oscillator consists of two lines:
The %K line: Tells you where the closing price of a security is with regard to price range.
The %D line: A moving average of the %K line, most often a 3-day SMA, which is used to smooth out fluctuations and noise in order to make spotting trading signals easier.
The value of the stochastic oscillator is range-bound — it’s always between 0 and 100. Values over 80 indicate overbought conditions, while values below 20 indicate oversold conditions.
In the chart above, the stochastic oscillator reaches values of 95, indicating oversold conditions – and a correction quickly follows.
High and low values often lead to pullbacks and reversals, but strong trends can cause overbought and oversold conditions to last for a long time.
So, apart from simply looking for values over 80 and under 20, how can we use this indicator? Crossovers and divergences:
When the %K line crosses over the %D line: Strong bullish signal
When the %K line crosses under the %D line: Strong bearish signal
Price reaching lower lows while the oscillator reaches higher lows: Selling pressure is dissipating and a reversal into an uptrend might occur
Price making higher highs while the oscillator is making lower highs: Buying pressure is fading and a new downtrend might take hold.
Of all the indicators in this article, the stochastic oscillator is the most vulnerable to volatility. If markets are volatile, the indicator is prone to giving false signals. Make sure to always use it with other means of technical analysis.
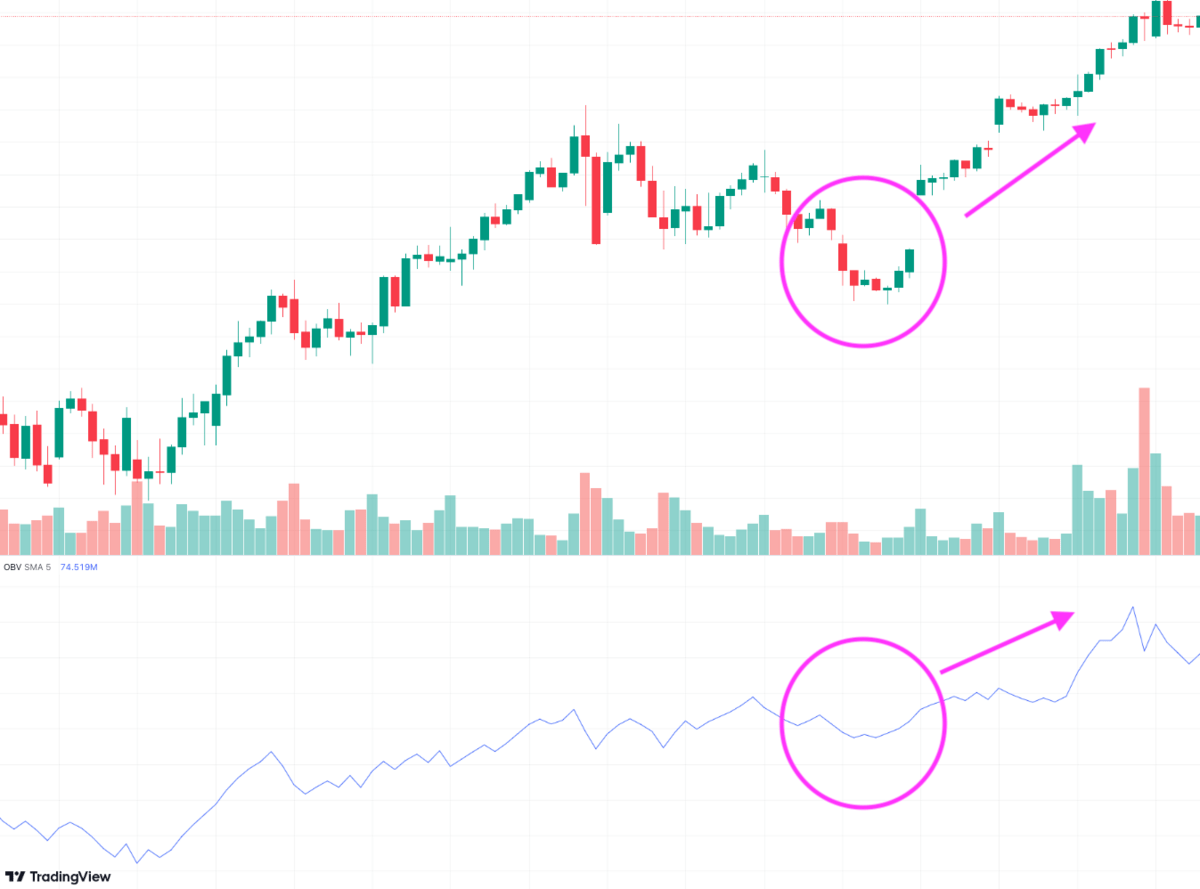
6. OBV (On-Balance Volume)
On-balance volume (OBV) is one of the best technical indicators for swing trading and a simple yet effective momentum indicator.
OBV adds up the volume on days where the price increased and subtracts volume on days where the price decreased. The rationale behind this method is that volume precedes price movements.
Increasing OBV is a sign that buying pressure is prevailing
Decreasing OBV is a sign that selling pressure is stronger
OBV’s primary utility is in confirming trends. If price action and OBV are moving in the same direction, this is a sign that the trend is strong.
Bullish divergence happens when a security’s price starts making lower lows, while the OBV is making higher lows, suggesting that selling pressure is dissipating.
Conversely, when the security’s price is making higher highs, while the OBV is making lower highs, buying pressure is dropping off, indicating another possible reversal.
OBV Indicator: Example
While the price action looked like Apple (NASDAQ: AAPL) was heading lower, a quick glance at the OBV told another story – selling pressure was light, and just a bit of buying would get the stock back on its long-term trend.
Although it is a great tool for confirming trends, OBV does have a couple of notable downsides. Major spikes in volume can throw the indicator off, so make sure to always keep one eye on an economic calendar. On top of that, the shorter the time frame, the less reliable this indicator is.
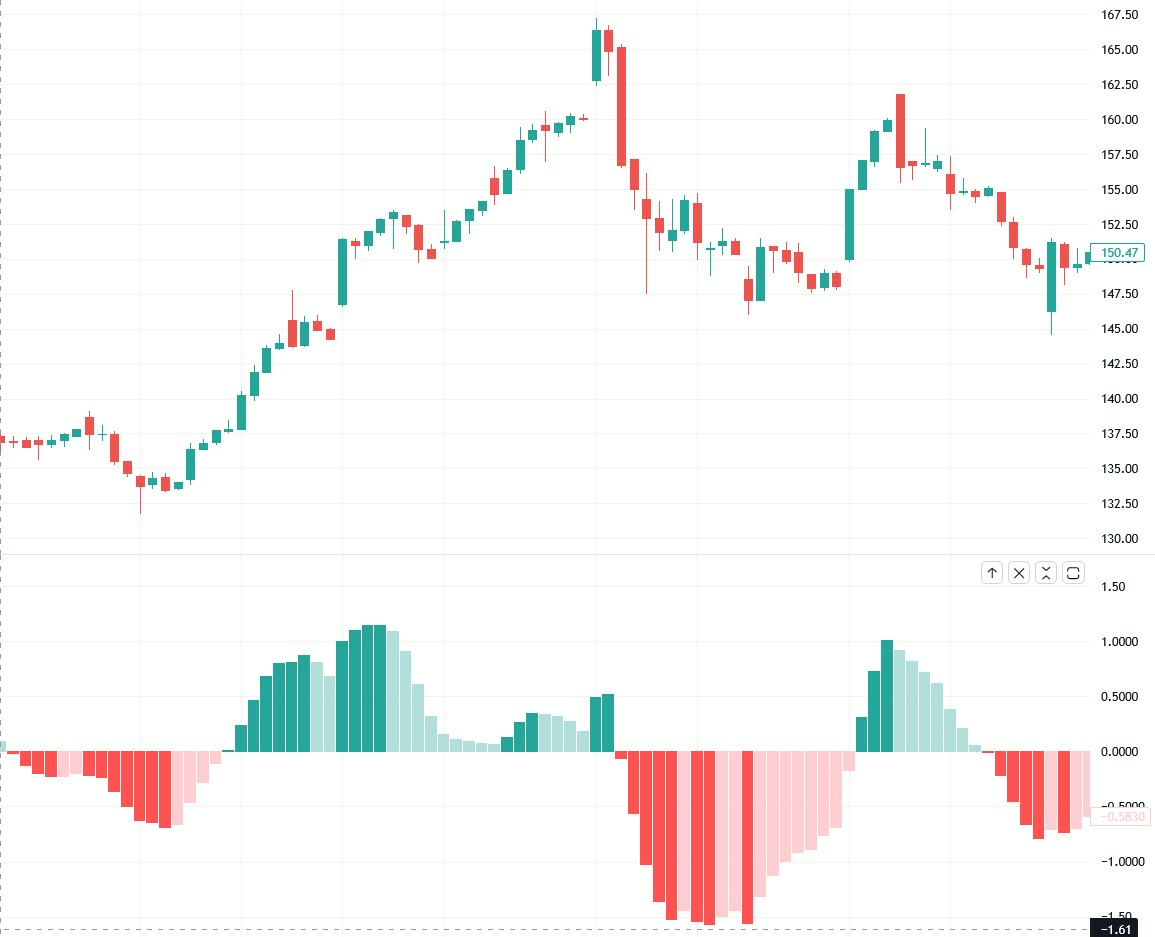
7. MACD (Moving Average Convergence Divergence)
MACD means “moving average convergence divergence.” It’s one of the best swing trade indicators because it’s so easy to incorporate into your decision-making process.
The MACD consists of two lines:
The MACD line, which you get by subtracting a 26-period EMA from a 12-period EMA
The signal line, which is a 9-period EMA of the MACD line
There are three primary ways in which the MACD indicator is used:
Crossovers
Divergences
Histogram
Both bearish and bullish MACD crossovers offer a handy way of identifying potential entry and exit points for trades:
When the MACD line crosses over the signal line, you’ve got a bullish signal.
When the MACD line crosses below the signal line, it is a bearish signal.
MACD Indicator: Example
Above, you’ll see the MACD indicator on a chart tracking Amazon (NASDAQ: AMZN) stock. The blue line is the MACD line, while the yellow line is the signal line.
Using crossovers for entry points like in this chart would provide you with an entry point at $103, while the exit signal would come at $114 two weeks later. Simple, actionable information like this makes MACD one of the best indicators for stocks.
As for divergences, when MACD and price action go in different directions, there are two possible takeaways:
MACD is making higher lows, while the price is making lower lows: Bullish divergence — selling pressure is weakening, and reversal into an uptrend could happen.
MACD is making lower highs, while the price is experiencing higher highs: Bearish divergence — buying pressure is waning, and a reversal into a downtrend is possible. See it illustrated below:
The histogram is a visualization tool that pairs well with this indicator. It basically shows the difference between the MACD line and the signal line:
Histogram is above zero = MACD is above the signal line, indicating bullish momentum.
When it is below zero = MACD is below the signal line, indicating bearish momentum.
MACD is the best indicator for trading when it comes to identifying trends. It works best in trending markets and is fantastic for identifying trend reversals, but it fares poorly in sideways trading and ranging markets, as well as markets that are prone to sudden price gaps.
What is a Swing Trading Indicator?
Trading indicators are mathematical equations that help traders decipher current and historical price data, in particular factors like momentum and trends.
Swing trading indicators are simply those that have been proven to mesh well with a strategy that involves holding a position for a few days to a couple of weeks.
What is Swing Trading?
Swing trading is a medium-term approach to investing. Instead of holding positions for less than a day like day traders, or for years and years like long-term investors, they instead attempt to profit from price “swings” related to market trends. There isn’t a specific time frame for swing trading, but it’s usually a few days to a few weeks.
Advantages and Disadvantages of Swing Trading
Even if you’re armed with the best swing trading indicators, it is important to be aware of the advantages and drawbacks of any trading approach.
Advantage
Explained
Profit potential
Swing trading usually involves identifying and taking advantage of short to medium-term trends. With good trend identification and proper risk management, swing trading can potentially yield sizable and consistent gains.
Flexibility and lower risk of burnout
Since positions are held for several days to several weeks, you don’t have to be glued to your screen. This makes it a relatively low-stress approach to trading.
Focus on technical analysis
Technical analysis is quantifiable data, which can be more accessible than fundamental analysis for some investors.
Diversification
Futures contracts, ETFs, options, and even cryptocurrencies can also be swing-traded, allowing for more diversity.
Disadvantage
Explained
Overnight and weekend risk:
Overnight and weekend risk refers to the fact that unexpected news often occurs outside of trading hours or over the weekend. Earnings releases, geopolitical events, macroeconomic news — all of these factors can cause the closing price of one day and the opening price of the next day to be radically different.
Larger stop losses
Swing trading relies on holding positions for days to weeks, so traders are exposed to a lot more price fluctuation when compared to day traders for example. Wide stop losses allow traders room to breathe, but if the price does move downward, losses can be substantial.
Market volatility
Volatile periods can often lead to choppy or inconsistent price action, making identifying clear trends much more difficult even when using the best indicators for swing trading. Volatility can increase overnight and weekend risk as well.
Slower profit realization
Swing traders may have to wait longer for profit realization in comparison to day traders and scalpers.
Final Word: Best Indicator for Swing Trading
Technical indicators are like navigational tools for swing traders. Like all tools, they have specific purposes, and they require knowledge to use — but if you apply due diligence and confirm any leads via multiple indicators, they can help improve your results.
But keep in mind that stock indicators should not be used solely to determine whether to enter or exit a trade. Rather, they’re just part of the process of making informed trades with a greater sense of conviction.
FAQs:
Is MACD a good indicator for swing trading?
Yes. MACD, which means “moving average convergence divergence,” is one of the best swing trade indicators because it’s so easy to incorporate into your decision-making process. Both bearish and bullish MACD crossovers offer a handy way of identifying potential entry and exit points for trades.
Which RSI is better for swing trading?
Relative Strength Index (RSI) is one of the best swing trade indicators. It measures two things: how quick and how drastic price movements are. The value of the RSI, which goes from 1-100, is easy to understand — RSI values in excess of 70 indicate that a security is overbought, and RSI values under 30 suggest that a security is oversold. Which RSI is better depends on various factors, including the stock you’re trading and whether you’re going long or short.
Do stock indicators work?
Yes. Stock indicators are like navigational tools for swing traders. Like all tools, the best stock indicators have specific purposes, and they require knowledge to use — but if used properly, they can help improve your results. However, they should not be used solely to determine whether to enter or exit a trade but as part of the process of making informed trades with a greater sense of conviction.
Where to Invest $1,000 Right Now?
Did you know that stocks rated as "Buy" by the Top Analysts in WallStreetZen's database beat the S&P500 by 98.4% last year?
Our July report reveals the 3 "Strong Buy" stocks that market-beating analysts predict will outperform over the next year.
Mijusko Sibalic is a content writer and copywriter that wandered into the financial space from a background in political science. Ever since then, his professional sights have been set on the same goal - communicating important topics regarding investing and the journey to financial independence to the wider public.
Sign up to get daily digests on the stocks that matter to you.