Lincoln is an investor and content marketer. He has worked for financial advisors, institutional investors, and a publicly-traded fintech company. Lincoln holds degrees in Finance, Economics, and Accounting.
You might be interested in Investors Underground, a day trading community with exceptional educational materials.
IU offers 3 trading courses with a track record of transforming brand-new traders into full-time trading professionals.
Spoiler alert – it’s bullish.
There are countless bullish patterns, but the triple bottom is one of the most reliable (and potentially profitable) among them. It is a bullish reversal pattern, meaning it occurs at the end of a long downtrend and signals the beginning of a bull run.
Its reliability stems from 2 factors: It’s easy to spot (as you will see below) and rarely has false moves, assuming you trade it correctly and know what to look for to confirm the pattern’s authenticity.
That said, let me give you the overview of the triple bottom pattern along with its strengths, limitations, and how to trade it.
I’m confident that knowing this pattern well will give you a reliable, profitable tool to your investing toolkit.
What Is a Triple Bottom Pattern?
A triple bottom pattern is a bullish reversal chart pattern that is formed at the end of a downtrend. It appears rarely, but it always warrants consideration, as it is a strong signal for a significant uptrend in price.
Unlike many patterns, the triple bottom pattern works best as a swing trading pattern, which gives its traders ample room to collect profits.
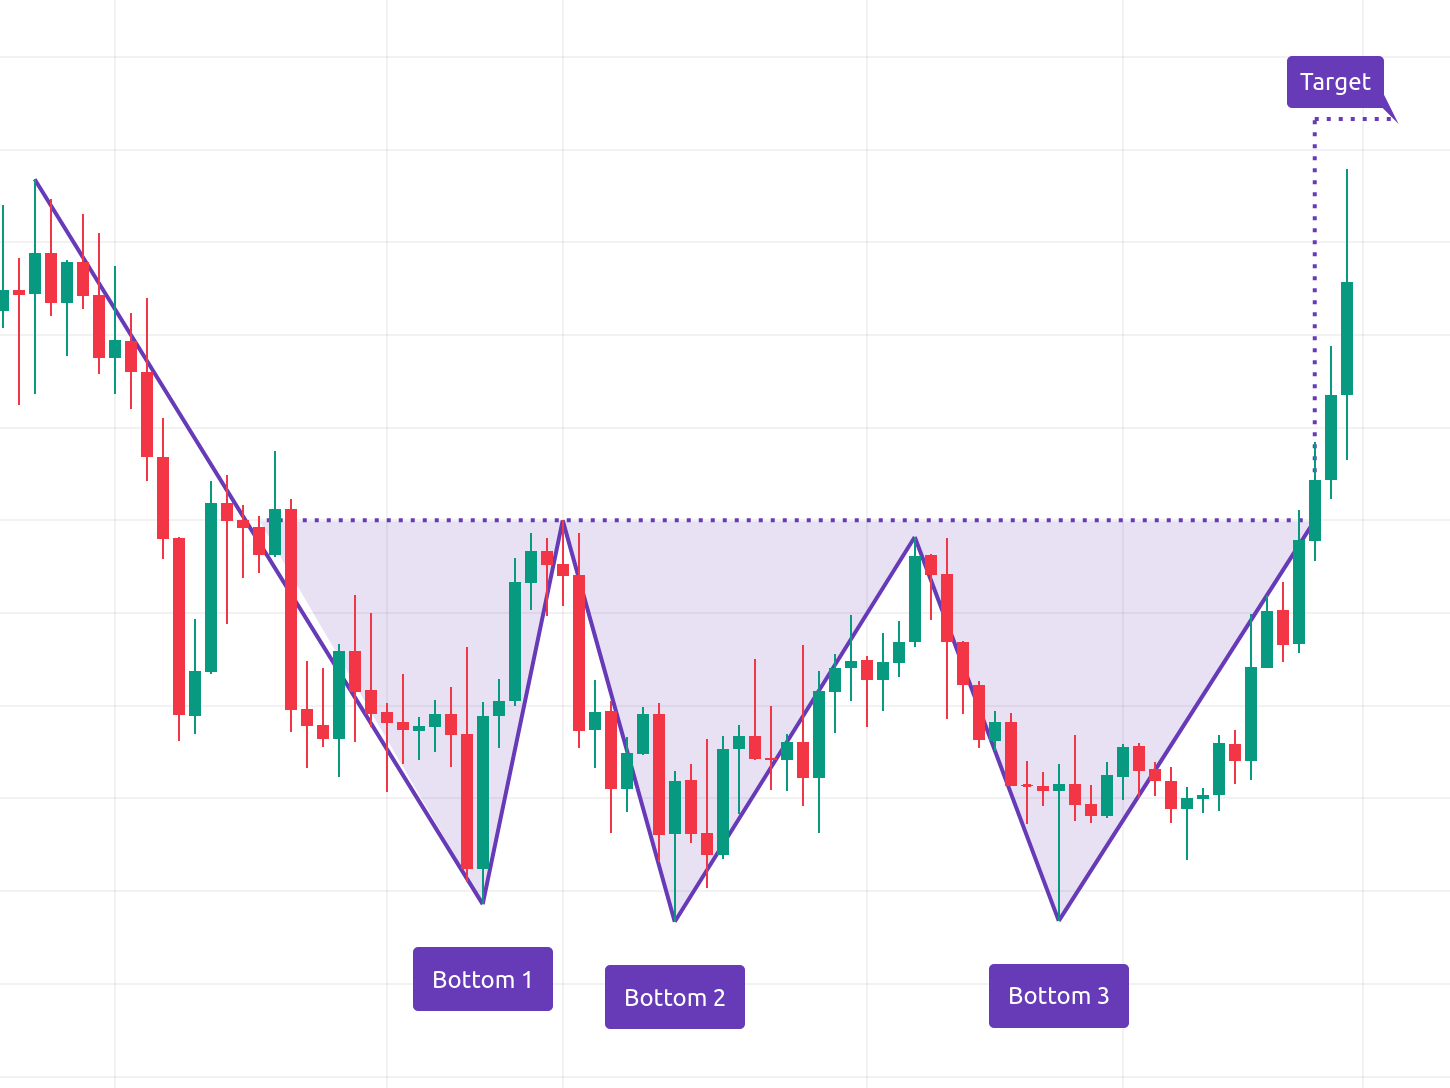
It consists of three distinct lows that are roughly equal in price and separated by two intermediate highs. This forms the distinctive W-shape of the pattern, which you can see in the image below:
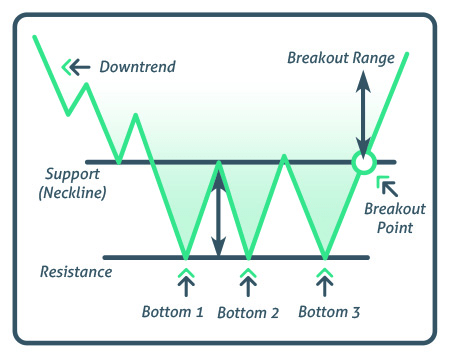
Note that if the “Bottom 2” falls below the resistance line, the chart is more accurately described as a reverse head and shoulders.
This pattern of price action suggests a couple of things:
- After months of bearish activity, downward pressure is abating
- The three peaks reaching the neckline show increased activity from bulls
- The three bottoms show a new level of support, below which the stock won’t fall
After a long period of dropping, prices have found a floor and bulls have made repeated attempts to drive the price higher. Should those attempts come to fruition, we’re looking at a trend reversal, and a great place to enter a long position.
The triple bottom pattern is best suited to swing trading, as the months-long formation of the pattern signals that the bears have run out of steam. If that scenario pans out, the resulting uptrend is typically several weeks long – perfect for a hands-off approach like swing trading.
How to Spot a Triple Bottom Pattern
First things first – context and timing matter.
You should be looking for the triple bottom pattern at the end of an extended downtrend. The best triple bottoms usually form over a period of 3 to 6 months.
You should look for:
- Three distinct lows that occur at roughly the same price levels
- Two intermediate highs, also roughly equal in price
- A breakout beyond the two peaks after the third bottom
Although it isn’t a hard and fast rule, the more even, well-spaced, and equal the highs and lows, the better. We’ve already seen one idealized version of this chart above – let’s take a look at one you would see in real life:
Stock Triple Bottom Example:
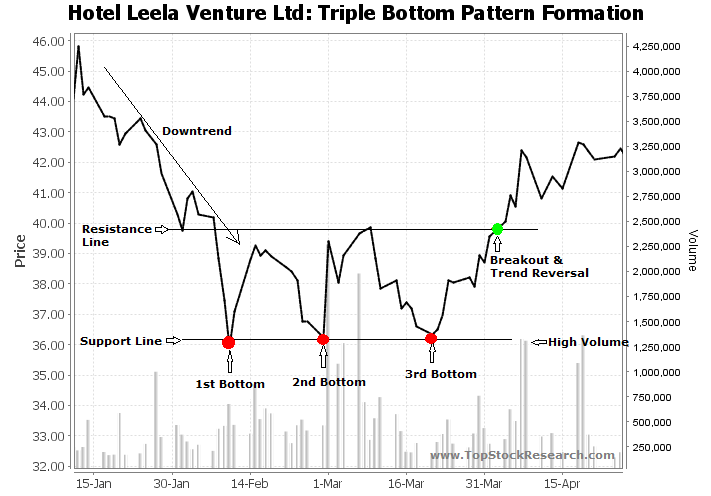
The chart doesn’t look quite as neat, but it meets the key criteria – it occurs during a long downtrend, exhibits equal lows, and forms over a period of roughly 3 months.
Take note of the volume indicators at the bottom of the image – they correlate strongly with upward swings, and volume increases as we get nearer to the breakout.
Stock Market Guides helps traders find specific stock setups with a backtested edge by pairing technical signals with historical performance data. Each scan shows how similar setups have performed in the past, making it easier to filter for high-probability trades with confidence.
How to Trade a Triple Bottom Chart Pattern
After successfully locating a triple bottom chart pattern that meets the criteria above, traders will wait for the price to break above the neckline. Once this occurs, traders will enter their swing positions and wait for the stock to rally higher.
Given the extended downtrend, it’s safe to assume that traders and investors have been waiting for the stock to reach a level of consistent support. Once it demonstrates that, investors will start buying up the stock, sending it higher. This is the move traders want to be a part of.
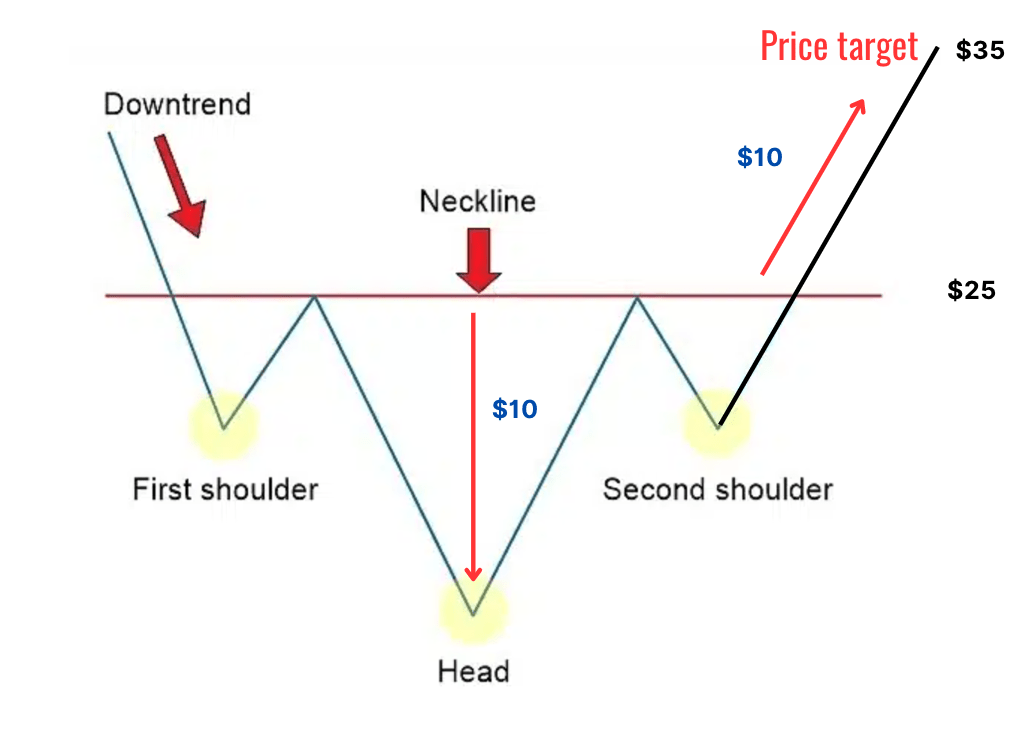
Traders will set price targets on triple bottom patterns in 1 of 3 ways:
- Measure the height of the triple bottom pattern (from the lowest low to the neckline) and use that as the expected price move. For example, if the pattern height is $5, traders may set a price target of $5 above the neckline.
- Use Fibonacci retracements to set price targets at the 61.8%, 100%, or 161.8% retracement levels.
- Price targets can be set based on key support and resistance levels like previous highs or resistance levels that the stock has struggled to break through.
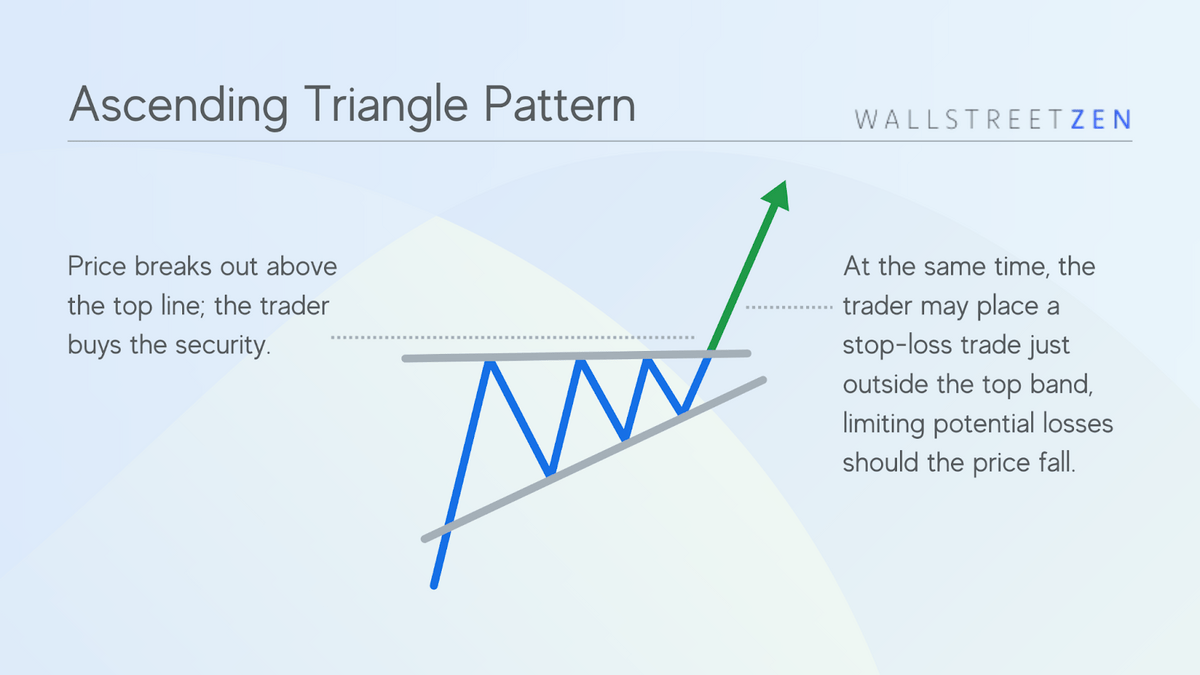
You should also consider:
- placing a stop loss set just below the lowest trough of the pattern, in case the reversal doesn’t hold.
- using other technical indicators, such as volume or moving averages, to confirm the bullish reversal.
Keep in mind that setting a price target is never an exact science. For instance, if multiple other indicators show signs of strength you may decide to set a higher price target.
Even if short-term trading isn’t your cup of tea, the triple bottom stocks pattern still presents a great opportunity. Long-term investors will find that this pattern, if confirmed, shows a great place and time to purchase a security with the intent of holding it for a long time.
Pros and Cons of Trading a Triple Bottom
Pros | Cons |
Easy to identify the pattern | Chart pattern takes long to form |
Often a sign of strong upcoming price action | Occurs infrequently |
How Reliable Is a Triple Bottom Stock Pattern?
The reliability of a triple bottom chart depends on a number of factors, including the timeframe you are trading on, the strength of the downtrend, and overall market conditions. In general, the pattern is more reliable on longer timeframes, and when the downtrend is more pronounced.
It’s important to use other technical indicators to confirm the pattern. For example, in most cases of legitimate triple bottoms, trading volume declines after the first bottom – and only picks up pace as the final bottom is printed and the line of support is breached.
On top of volume, a lot of traders also utilize RSI, an indicator of whether a security is overbought or oversold, and MACD, to confirm the veracity of triple bottoms.
As far as concrete data goes, research from author Tom Bulkowski suggests that the pattern pans out and reaches conventional price targets 74% of the time.
All things considered, the triple bottom pattern is incredibly consistent – but it appears rarely.
Final Word: Triple Bottom Pattern
Trading the triple bottom pattern can be a useful strategy – identifying the reversal of a bearish pattern on time is the closest thing there is to a layup in investing. The beginning of a long-term uptrend is a great place to enter a position.
Like every tool, this one also has its limitations. The infrequency of this pattern, together with the long timeframe needed for its form means that there will, unfortunately, be no layups.
Properly applied with indicators and other vectors of technical analysis, the triple bottom stock pattern will help you make use of opportunities you might have otherwise missed, as well as help you make more informed investing decisions.
FAQs:
What does the triple bottom pattern mean?
A triple bottom chart pattern means that a reversal of an ongoing bearish trend might occur.
Is a triple bottom better than a double bottom?
A triple bottom ends up in a reversal more often than a double bottom. However, this doesn't necessarily mean one is “better” than the other - double bottoms are much more common, and can lead to plenty more trading opportunities than their triple counterparts.
What is the success rate of the triple bottom pattern?
According to research, analysis, and backtesting performed by stock chart pattern experts such as Thomas Bulkowski and Cody Hinds, the success rate of the triple bottom pattern is between 74% and 79%.
How reliable is a triple bottom?
The triple bottom pattern is one of the most reliable stock chart patterns, with some estimates suggesting that it leads to a reversal into an uptrend around 75% of the time.
Is a triple bottom bullish or bearish?
A triple bottom stock pattern is bullish - it is a reversal pattern that signals the end of a bear rally.
Where to Invest $1,000 Right Now?
Did you know that stocks rated as "Buy" by the Top Analysts in WallStreetZen's database beat the S&P500 by 98.4% last year?
Our June report reveals the 3 "Strong Buy" stocks that market-beating analysts predict will outperform over the next year.