Jessie Moore has been writing professionally for nearly two decades; for the past seven years, she's focused on writing, ghostwriting, and editing in the finance space. She is a Today Show and Publisher's Weekly-featured author who has written or ghostwritten 10+ books on a wide variety of topics, ranging from day trading to unicorns to plant care.
The best charting app & broker for triple top patterns…
If you’re looking for a stock charting app, there’s a good chance that you’re also looking for a broker. TradeStation has the best free charting software on the market – and if its proprietary charts aren’t enough for you, it integrates fully with TradingView! That means you can use TradeStation for your broker and make trades directly from a TradingView chart.
But TradeStation’s in-house charts shouldn’t be overlooked. Its custom-built tools include:
- Chart Analysis – a multi-function window where you can look up price data, perform technical analysis, back-test and automate strategies, and show orders and positions
- RadarScreen – one of the most specced-out stock screeners available, featuring alerts and real-time watchlists with 329 criteria built in
- Matrix – this takes all of the tools typically featured alongside charts (a market depth window, buy and sell signals, and an order-entry tool) and puts them into one window
Sign up for TradeStation here.
A triple top pattern is a potent weapon to have in your trading arsenal. This powerful technical tool helps traders identify price reversals following a rally.
Whether exiting a long position or entering a short, a triple top is a reliable indicator that can deliver an early warning to inform your next trade.
We’ll break down this popular technical tool so you understand precisely what it is, how to identify it, and (most importantly) how to potentially profit from it.
We’ll even walk through a real-life example, step-by-step.
Let’s get started.
What Is a Triple Top Pattern?
A triple top pattern, also called a triple top reversal, is a charting pattern used in technical analysis that signals a potential reversal.
The triple top pattern consists of three similar price highs with price pullbacks between the peaks. Upon completion, it resembles the shape of the letter M.
While a similar-looking formation can occur at various times, a true triple top pattern must follow a rally.
When the triple top formation occurs, it implies an asset may have concluded a recent rally and is likely to reverse course and begin to fall more substantially than previous legs.
Since a triple top stock pattern suggests a peak has been reached and a large drop in price is likely, the pattern is considered bearish.
A predetermined support level represented by prior recent lows acts as a trigger point. According to this technical tool, when the price of the security breaches this line from above (i.e. when the price falls below the support level), a further leg down in price is likely to occur.
Why is this?
The recent lows represent buying pressure where buyers have repeatedly stepped in to bid the price up. Once the line is broken, it implies the previously motivated buyers are no longer showing up, and a further drop is likely imminent.
Imagine you’re tracking the price in the following example. After peaking at the third top, it proceeds to drop and breach the support line ($108). Since this signals a further drop is likely, a trader might decide to do one of two things:
- Exit the existing long position in the stock.
- Enter a short position in the stock.
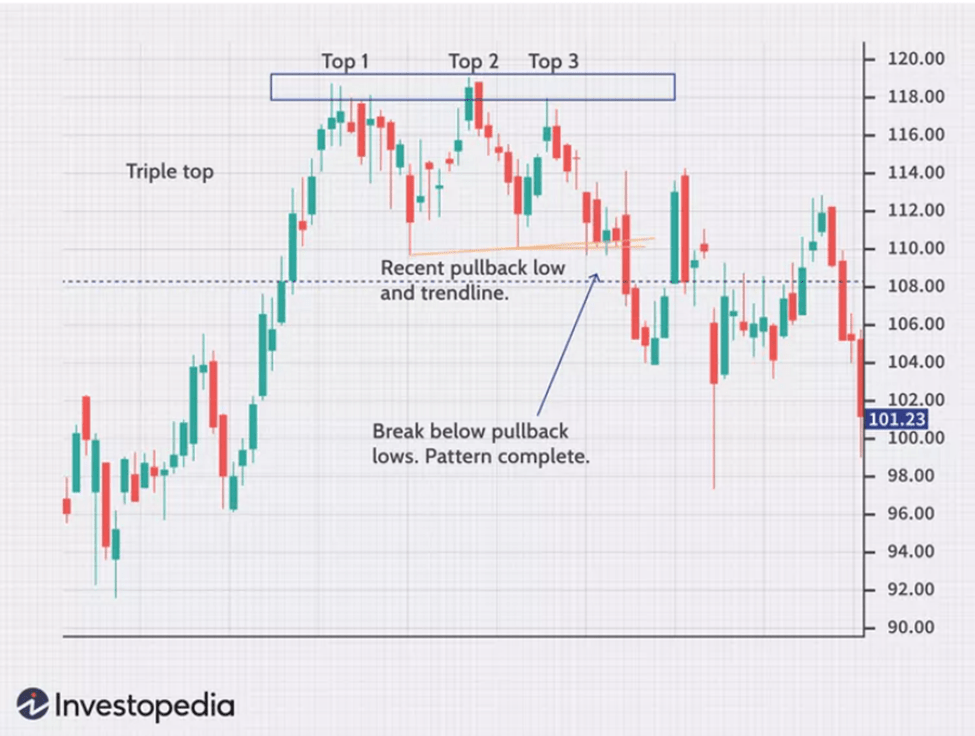
Continuing with this example, the price does indeed fall further from $108 to $104. It then begins to oscillate around the former support line before eventually slipping all the way to $101.
But how far will it fall?
Typically, once a triple top pattern is formed (i.e. once the support line is breached), it’s expected the price will drop equivalent to the difference between the top formations and the support line.
Using the same example, if the top is roughly $119 and the support line is $108, the difference is $11. Therefore, a trader might expect the price to fall $11 below the support line once it’s breached. In this case, it would mean the price is expected to continue to slip down to $97.
The Ultimate Day Trading Setup
- The best brokerage for day trading: TradeStation
- The best day trading ecourses & community: Investors Underground
- The best day trading computer: Radical X13
- The best charting platform: TradingView
How to Spot a Triple Top Pattern
No technical analysis tool or chart pattern is an exact science. There isn’t a precise formula for the triple top pattern — rather, it should be identified using a combination of software and experience.
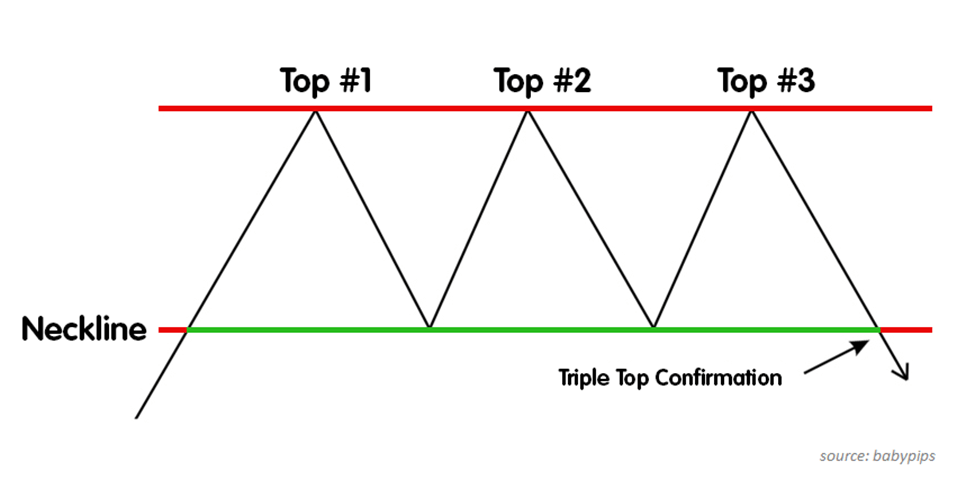
Here are the elements to look for in a triple top pattern:
- The formation must follow a rally.
- Three price peaks (price highs) of roughly the same level. These peaks represent the resistance line for the stock’s price. In other words, the resistance line represents the highest price the security has recently attained before pulling back.
- Price pullbacks to swing lows. These lows help inform the support line, sometimes called the neckline. This is the lowest price the security has reached recently before subsequently retracing upwards.
- Price break out of the support level from above.
Let’s take a look at an example of the formation in the chart below:
- First, the security begins to rally, rising in price until it peaks at the first top.
- Next, the price proceeds to drop before rebounding at the neckline, rising again until stopped by the second top (resistance line).
- Once again, the price drops, hitting the neckline but not crossing it.
- The price moves up again but meets resistance at the red line once more (top #3).
- The price begins its final leg down, breaching the neckline (support), confirming that a triple top pattern has formed, suggesting the price of the security will likely continue to drop even further.
Think of it this way: the resistance and support lines represent critical points in the battle between buyers and sellers. These are the price points where sellers overtake buyers or buyers overtake sellers, leading to a reversal in the price trend.
Of course, the above image is a simplified representation of the formation. In reality, no security will produce such a symmetrical triple top pattern. Resistance and support levels and peaks and troughs will likely never perfectly align.
Now that you’ve seen a clean, theoretical example, let’s take it a step further. What might an actual formation look like?
Take a look at the following image showing the price of gold over the course of a year:

- At the end of 2018, the price of gold began to climb substantially from around $1,260 per ounce to roughly $1,360 per ounce. At that point, it reached the first top of what would become a triple top formation.
- Gold topped out and began to slip, with the price falling back to around $1,300, nowhere near the previous low that preceded the rally.
- The price rebounded off $1,300, creating the first discernable swing low before rising to the second top.
- Once again, the price of gold resisted rising over $1,360 (roughly) and dropped back down to the swing low of around $1,300.
- Yet again, the price began to rise, though notice the choppy trajectory towards the third top. At one point, before hitting the third peak, the price nearly reached that level before retreating slightly.
- After testing the resistance line for a third time, the price of gold began to slide considerably, clearly breaching the neckline and confirming the existence of the triple top pattern.
It’s critical to understand that charting tools like the triple top formation are rarely clean or perfectly symmetrical. It’s also subjective — one person might clearly see the formation in the gold example above, while another may consider it incomplete.
Still, when zoomed out at one year in length, most traders would agree that the price pattern of the gold example forms a clear triple top, despite its bumpy trajectory.
You might be interested in Investors Underground, a day trading community with exceptional educational materials.
IU offers 3 trading courses with a track record of transforming brand-new traders into full-time trading professionals.
How to Trade a Triple Top Chart Pattern
You now understand how to identify a triple top breakout pattern. How can you apply this knowledge in your trading?
We know a triple top is a bearish signal. Therefore, if you identify the pattern, it’s likely that the price of a stock will fall. As mentioned earlier, when the breakout occurs (the final criteria required to complete a triple top), there are two profitable trades that might be executed:
- Exiting an existing long position.
- Entering a new short position.
Let’s revisit the gold chart from above to see how this pattern might play out in the real world.
Imagine you’re monitoring the price of gold, looking for potentially profitable trades. Around April 2018, you notice a possible triple top forming —the cost of gold has peaked at around $1,360 per ounce for a third time, with minor pullbacks between the highs, and is again beginning to fall.
The pattern is emerging but not yet confirmed.
You determine that if the price of gold drops below the support line (red dotted line) after having reached the third top, the price will likely fall even further. If the price breaches the support line, you want to enter a short position.
Following the third top formation, you wait for gold to breach the $1,300 support line, which it does in the middle of May:
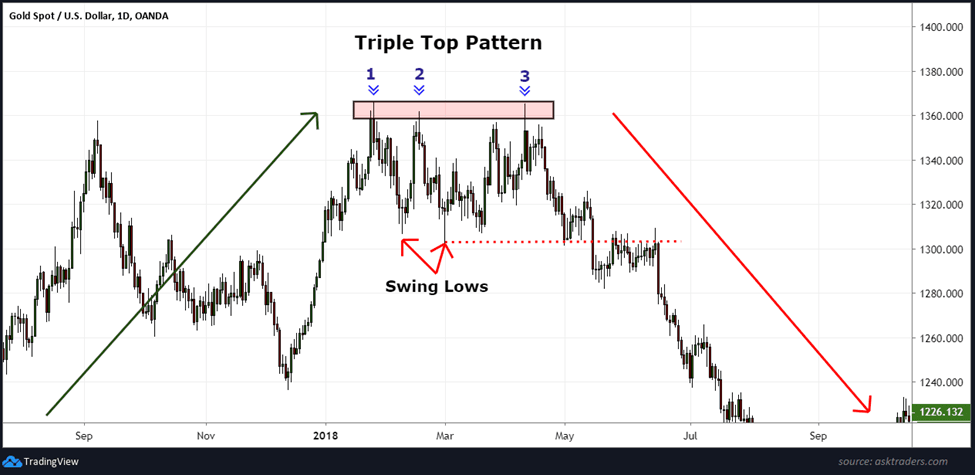
Gold fails to retake the prior support level at $1,300, which turns it into a resistance line where gold drops below $1,226 from there.
Since the difference between the tops (at $1,360) and the neckline (at $1,300) is $60, your price target was set for $1,240, where gold found some support at the end of June.
Pros and Cons of Trading a Triple Top
Pros | Cons |
|
|
|
|
|
|
How Reliable Is a Triple Top Pattern?
When used conservatively and in conjunction with other analysis tools, the triple top pattern can arm traders with an invaluable weapon when sparring with the markets.
The triple top pattern isn’t perfect, nor is it meant to be. It’s just one piece of the puzzle — a method of market analysis built off the understanding of human psychology and the trajectory of prices over time.
However, when combined with knowledge, experience, and other technical analysis tools, it can be an extremely reliable tool to help you make more educated trading decisions.
Final Word: Triple Top Pattern
There’s a reason why so many traders rely on the triple top pattern. It’s easy to understand and identify and can help you determine better entry and exit points.
Like with all technical analysis tools, repetition will help elicit its true value, and software can assist with cumbersome analysis. When used in conjunction with other analysis tools, triple top patterns can prove an invaluable addition to your trading repertoire.
FAQs:
Is a triple top bullish?
No, a triple top pattern is not a bullish indicator. A triple top pattern is a bearish signal since it suggests a security’s price has reached a ceiling (resistance) and will likely experience a substantial fall in price in the near term.
How reliable is a triple top?
No charting pattern is guaranteed to work. However, the triple top stock pattern is among the most reliable charting tools when used responsibly. While the pattern won’t always lead to a drop in a security’s price, it can alert you to trading opportunities. As you develop more experience, you may be better-able to identify high-potential trades.
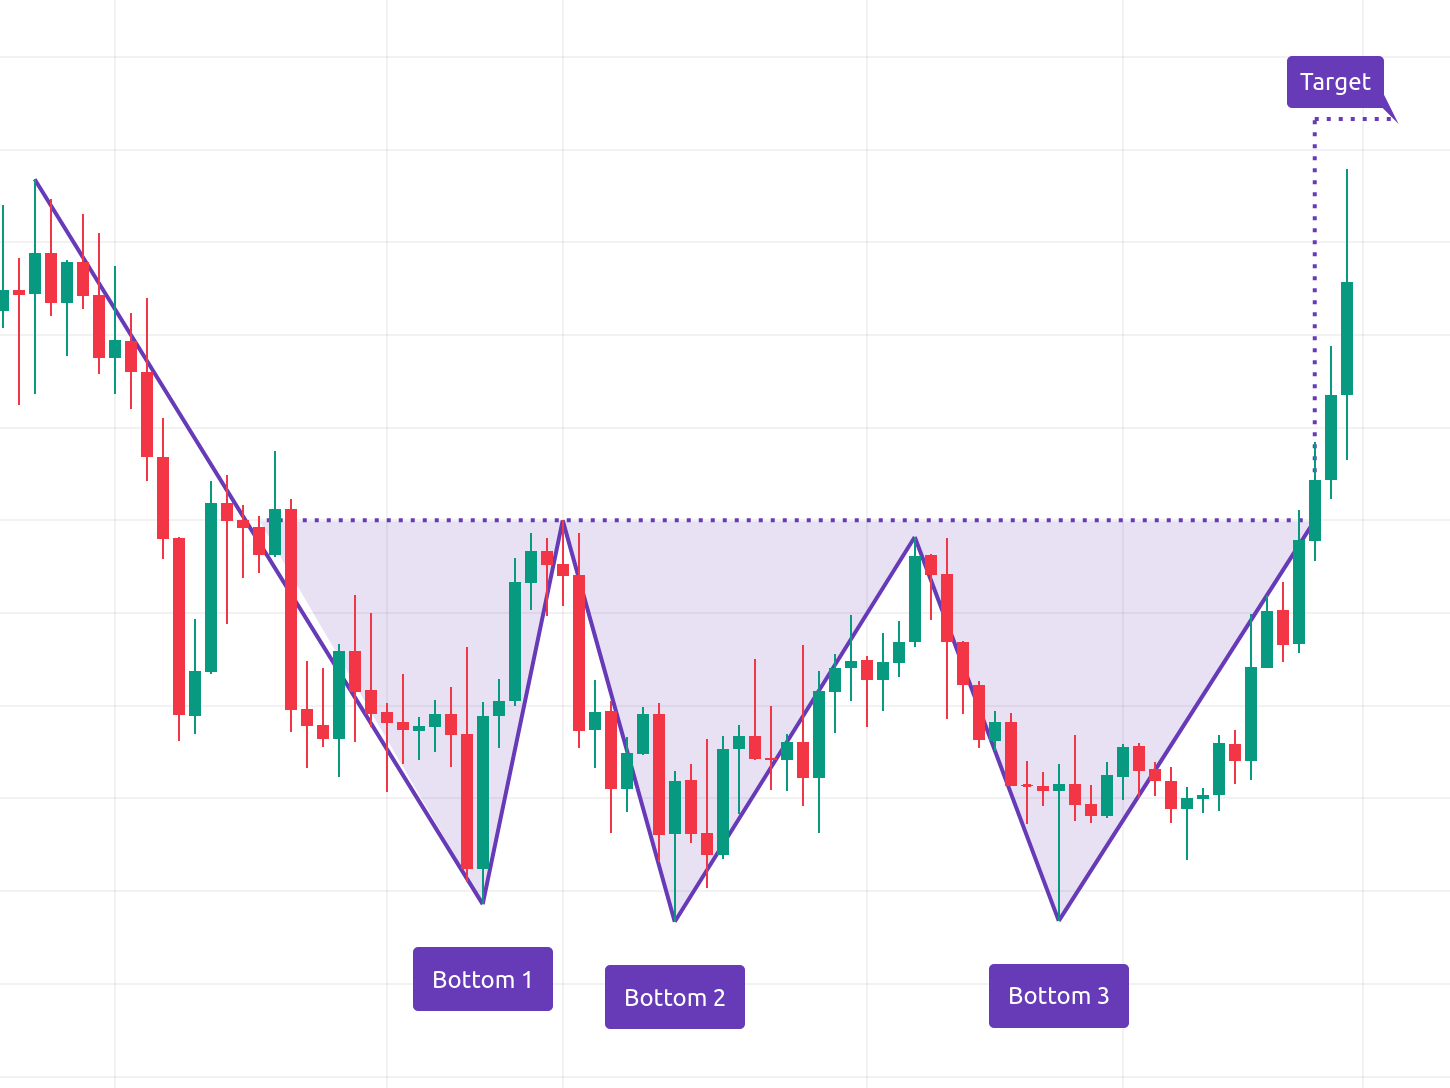
Is a triple bottom bullish or bearish?
A triple bottom is bullish. A triple bottom is similar to a triple top, but instead of three peaks of roughly similar size following a rally, it requires three troughs of approximately the same size following a short term crash in price. While a triple top suggests a price will likely continue to fall, a triple bottom means a price will likely continue to trend upwards.
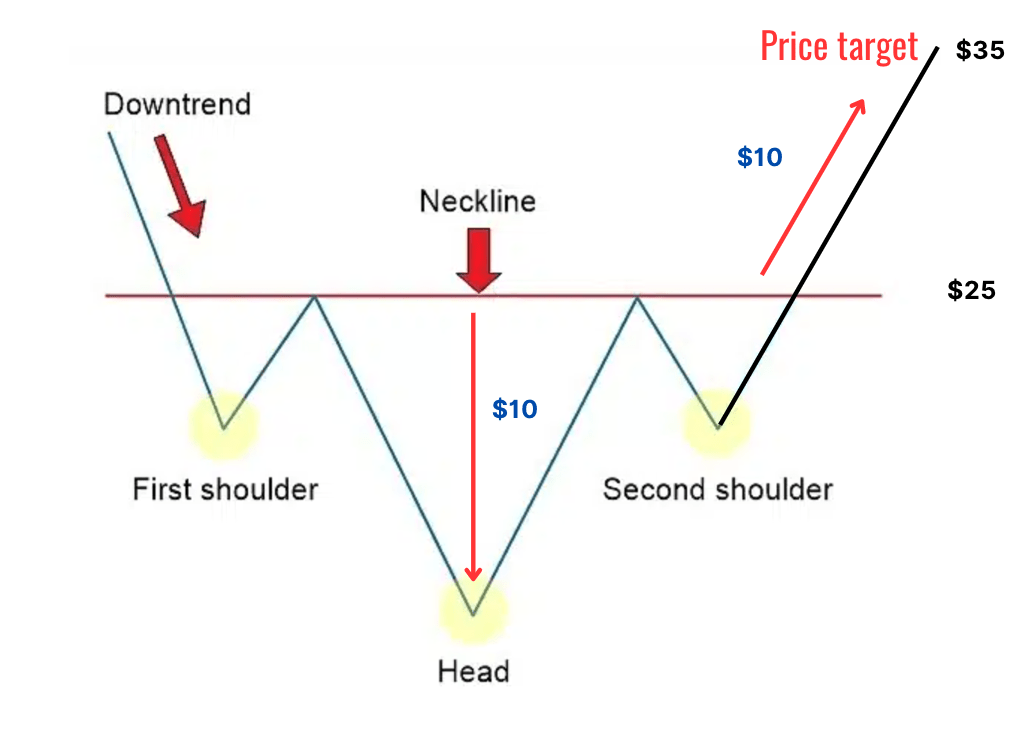
Is a triple top pattern the same as head and shoulders?
No. While they share similarities,a triple top pattern is not the same as a head and shoulders formation.
A triple top pattern has three peaks at roughly the same price level. A head and shoulders, on the other hand, will have three peaks, but the second peak will be higher than the first and the last (which are themselves relatively similar in price). This is where the formation gets its name since the second top resembles a head between two lower (but roughly equal) shoulders.
Where to Invest $1,000 Right Now?
Did you know that stocks rated as "Buy" by the Top Analysts in WallStreetZen's database beat the S&P500 by 98.4% last year?
Our July report reveals the 3 "Strong Buy" stocks that market-beating analysts predict will outperform over the next year.