Jessie Moore has been writing professionally for nearly two decades; for the past seven years, she's focused on writing, ghostwriting, and editing in the finance space. She is a Today Show and Publisher's Weekly-featured author who has written or ghostwritten 10+ books on a wide variety of topics, ranging from day trading to unicorns to plant care.
Want to gain an edge in the market? Start by gaining an understanding of bullish patterns and how they work.
Simply stated, bullish patterns are among the highest probability signals that an asset’s price will start ticking upward.
That said, there are a lot of patterns out there — it can be hard to know which bullish patterns are worth looking at or have the highest rates of success.
That’s what this article is all about. Below, I’ll analyze some of the most common bullish patterns and bullish signals, including examples of how pro traders use them to enter trades and exit with a profit while hedging their positions.
By the time you’re done reading, you’ll have a much better idea of how bullish patterns work — and how to put them to work in your investing.
Need charts? TradingView is the best app for stock charts – full stop. It was built first and foremost as a charting platform, which shines through in both its power and its wide range of charting applications.
As an active trader, you spend hours each day looking at charts. You want them to be easy to read and to show what you want to see at a glance — especially if you have a multi-monitor setup.
TradingView has the tools to show its information in a variety of ways. You’ll have customization options like 14 chart types, 90+ drawing tools, and 100+ pre-built indicators.
Even the free tier of membership is great — but the (still-affordable) paid subscriptions are even better. Try it free for 30 days and see for yourself — click the link below.
Bullish Patterns: The Bottom Line
There are certain bullish patterns, such as the bull flag pattern, double bottom pattern, and the ascending triangle pattern, that are largely considered the best. Understanding these top bullish patterns can give you an edge in the market by informing your entry positions, and helping you set appropriate price targets.
But keep in mind that every investor is different — the best bullish signals for you might be different than the guy down the street.
Also worth noting — chart patterns won’t be of much use if you don’t have great charting software. Like many investors, we prefer TradingView. Not only is it one of the better-looking platforms out there (so many look like they were made for Windows 95), but it’s also among the more powerful.
First Things First: 3 Bullish Candlestick Patterns to Know
Patterns come in all shapes and sizes. Let’s start with some simpler bullish candlestick patterns — these usually consist of just a few candles and are very easy to spot — in fact, there are even indicators that spot these automatically on TradingView.
Many traders use easily identifiable bullish candlestick patterns like these along with more involved chart patterns (which we’ll get into below) to find high-probability opportunities.
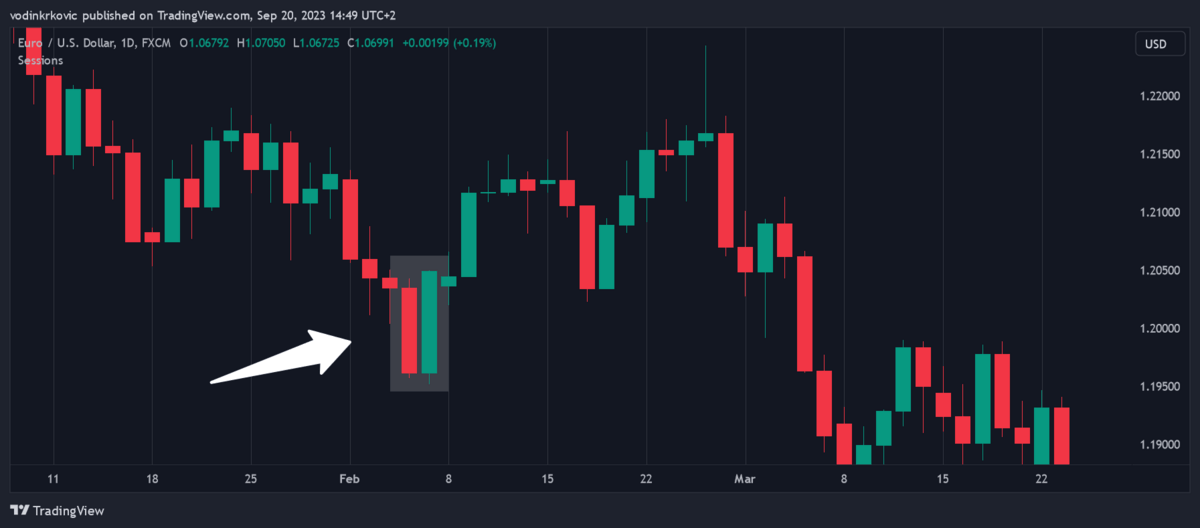
1. Bullish Engulfing
This is a two-candle pattern where a small bearish (red) candle is followed by a larger bullish (green) candle that completely engulfs the previous candle.
This pattern often signals a reversal from a downtrend to an uptrend — the larger green candle indicates that bullish sentiment has become dominant in the market.
This pattern is most useful for finding the exact moment when a reversal has already started — or in other words, it gives you confirmation of a reversal.
2. Hammer
This is a single candle pattern and it looks like a hammer — that is, a candle (either bullish or bearish) with no upper wick, a small body, and a long lower wick.
The long lower wick indicates that sellers pushed the price down during the session, but buyers were able to push the price back up to close near the open.
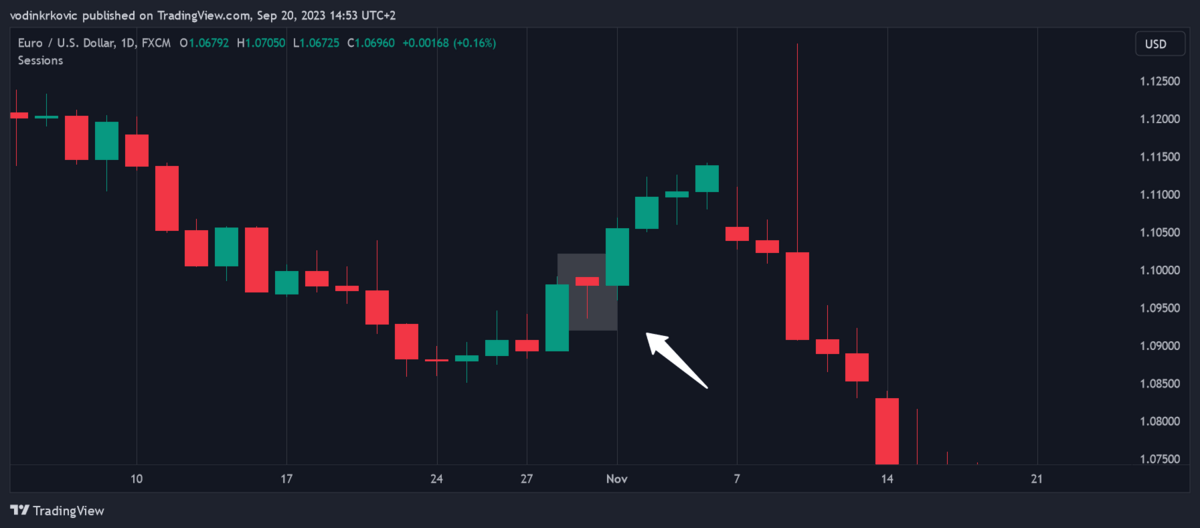
In other words, sellers tried to push the price down, but failed — this pattern often signals a potential bottom in the market or a continuation of an uptrend.
Discover more great charts — Check out TradingView for free.
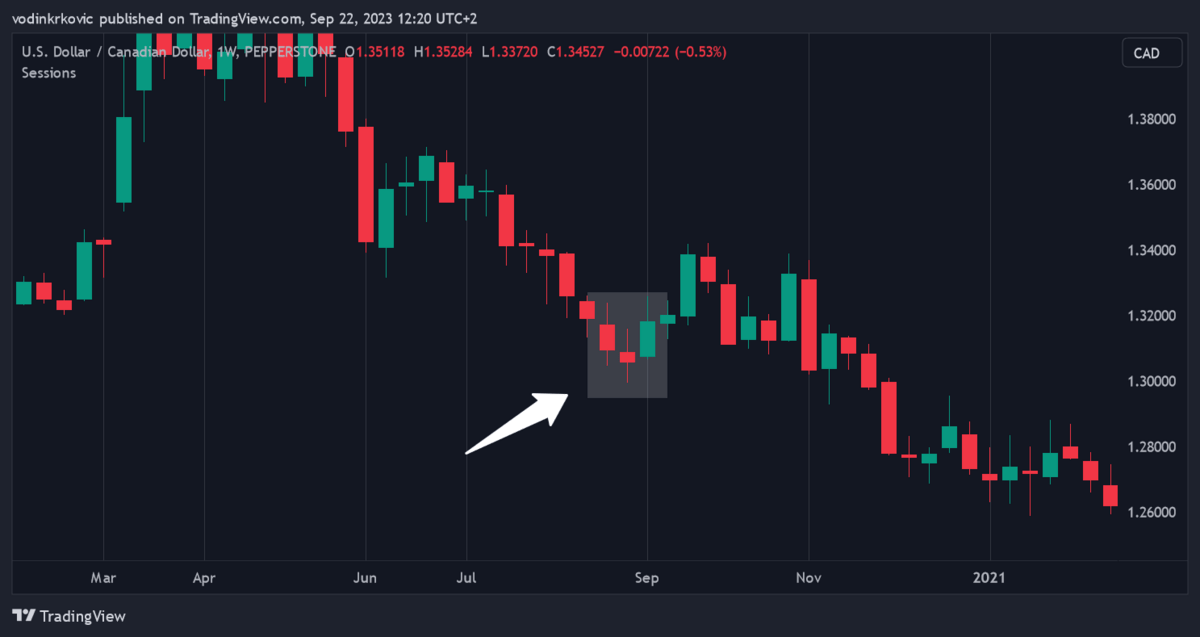
3. Morning Star
This is a pattern with 3 candles:
- Long bearish candle
- Small-bodied candle (which can be bullish or bearish) that gaps below the close of the first candle
- Long bullish candle that closes above the midpoint of the first candle.
This pattern indicates a potential reversal from a downtrend to an uptrend. In a nutshell, the small-bodied candle with a long wick indicates that sellers tried to push the price down, and failed — after that, a large green candle is a sign that the market is likely turning upward.
7 Bullish Patterns You Need to Know
Now, let’s expand on what we covered above and into more involved bullish patterns. Here are some of the most important ones to know about:
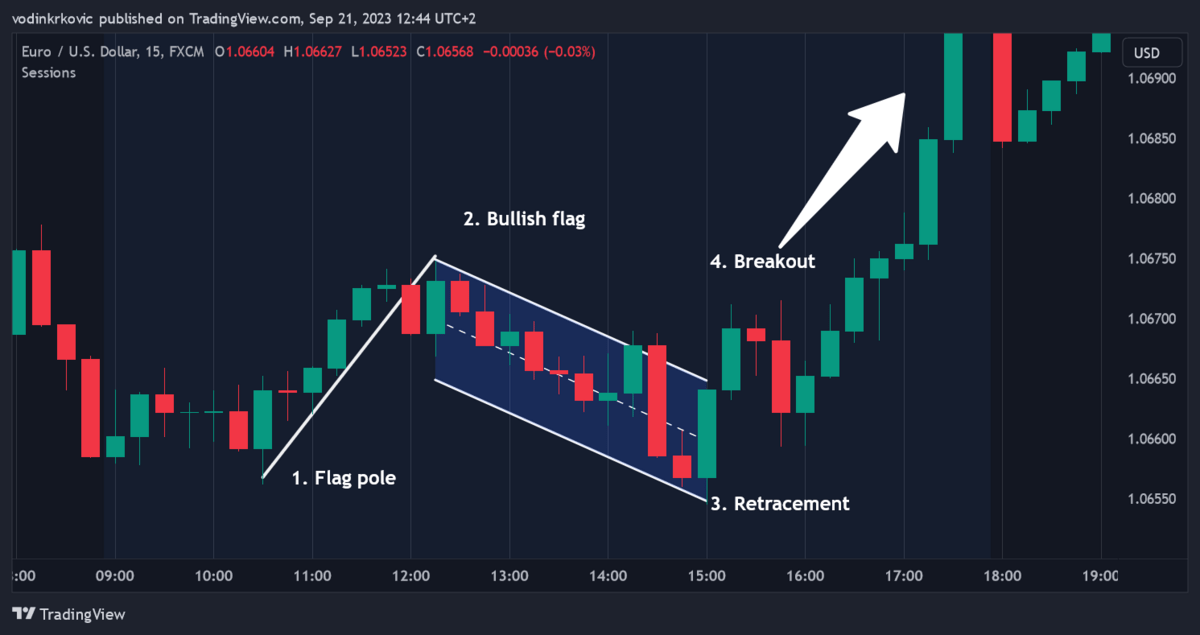
1. Bull Flag Pattern
The Bull Flag Pattern is a bullish continuation pattern. It signals a pause in an upward trend, followed by a continuation.
Key Characteristics of This Bullish Pattern:
The Bull Flag Pattern consists of two main parts: a “flagpole” and a “flag.”
The flagpole is a strong, sharp, nearly vertical price surge, while the flag is a period of consolidation that slopes against the previous trend.
The flag can be a horizontal rectangle, but is often a downward-sloping rectangle or a parallelogram.
The pattern is completed when the price breaks out of the flag area and continues in the direction of the previous trend.
Entry and Stop Loss Points
Traders typically enter a trade on a breakout above the upper trendline of the flag. A common place to set a stop loss is just below the lower trendline of the flag. The expected upward move in price after the breakout is typically the same length as the flagpole.
Additional Advice
I highly recommend using a volume indicator. A bullish spike in volume combined with a big bullish candle breaking out of the flag gives an even stronger signal that a breakout is happening.
Stock Market Guides helps traders find specific stock setups with a backtested edge by pairing technical signals with historical performance data. Each scan shows how similar setups have performed in the past, making it easier to filter for high-probability trades with confidence.
2. Double Bottom
The Double Bottom pattern is a bullish reversal pattern that typically comes after a long downtrend.
This pattern is interpreted as a sign that the market’s sellers are losing strength, and a significant reversal in price trend is imminent.
Key Characteristics of This Bullish Pattern
You can identify the Double Bottom pattern by two consecutive lows in price that are roughly equal, with a peak in-between, creating a “W” shape.
The pattern is confirmed when the price breaks above the highest point of the pattern, called the “neckline.”
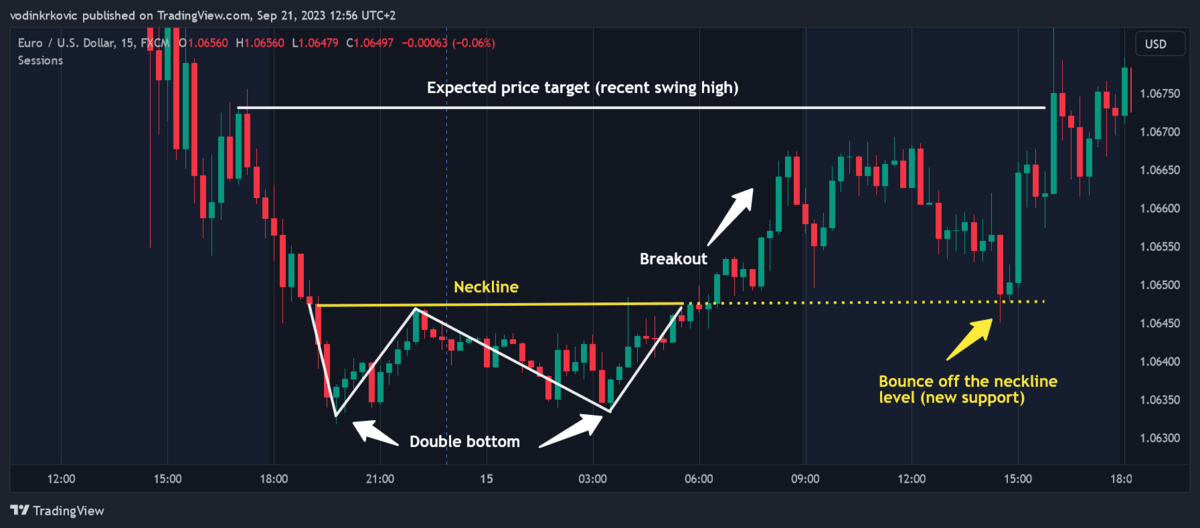
Entry and Stop Loss Points
Traders typically enter a trade when the price breaks above the neckline, confirming the pattern.
A common place to set a stop loss is just below the second bottom.
The expected upward move in price after the breakout is typically the same height as the pattern (the distance from the bottoms to the neckline).
Additional Advice
Once again, you can use a volume indicator for additional confirmation. Volume typically decreases during the formation of the second bottom and increases during the breakout.
Discover more great charts — Check out TradingView for free.
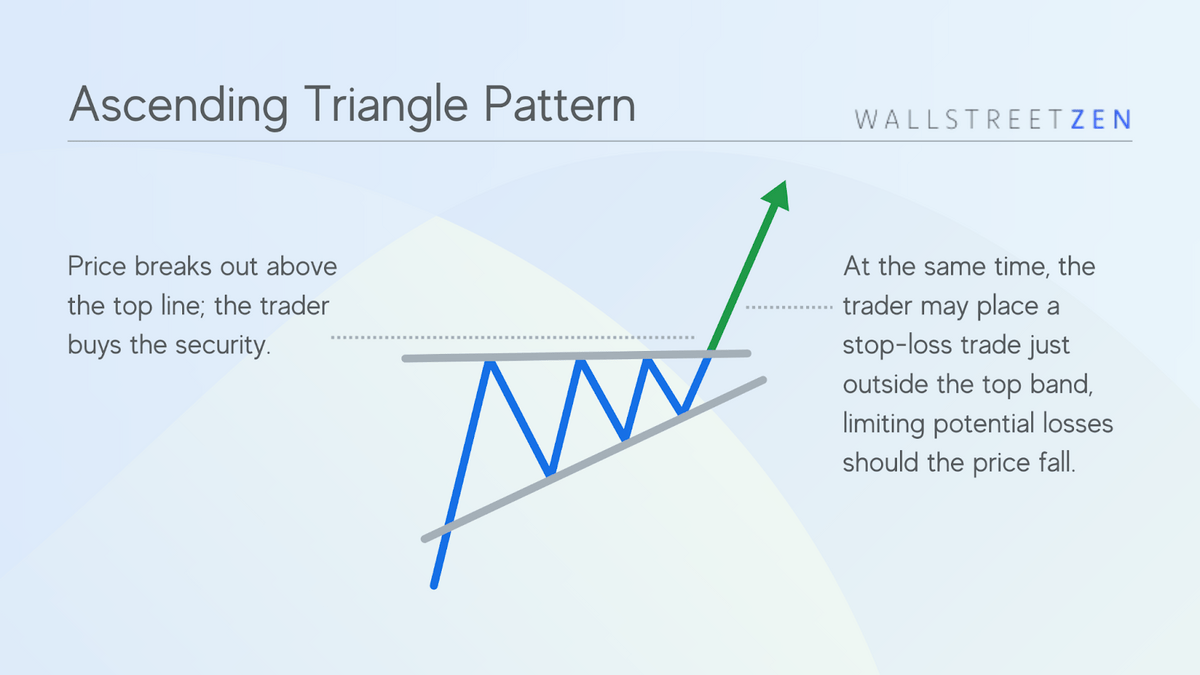
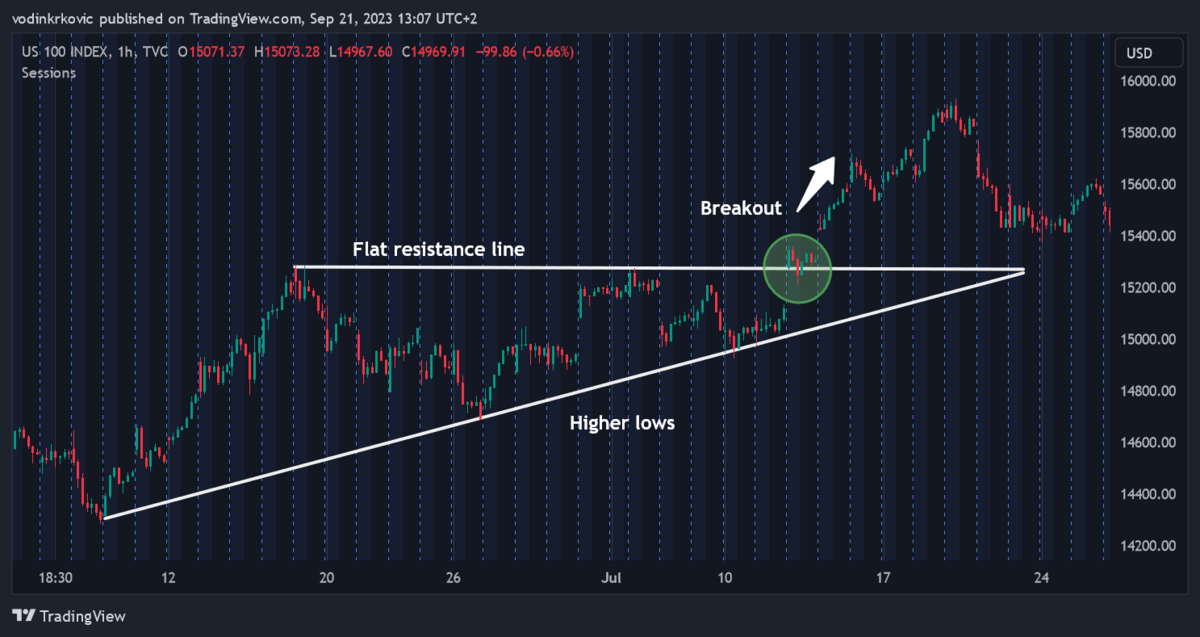
3. Ascending Triangle
The Ascending Triangle is a bullish continuation pattern that typically forms during an uptrend as a consolidation period.
This pattern suggests that buyers are more aggressive than sellers and that the price is likely to break out to the upside.
Key Characteristics of This Bullish Pattern
The Ascending Triangle pattern has a horizontal resistance line (formed by at least two highs at approximately the same level) and an ascending trendline (formed by higher lows).
The pattern is confirmed when the price breaks out above the resistance line.
Entry and Stop Loss Points
Traders enter a trade when the price breaks out above the resistance line, confirming the pattern.
A common place to set a stop loss is just below the ascending trendline or the most recent swing low within the triangle.
The expected upward move in price after the breakout is typically the same height as the pattern (the distance from the start of the upward trendline to the resistance line).
Additional Insights
Again, volume can provide additional confirmation.
Volume typically decreases during the formation of the triangle and increases during the breakout.
4. Cup and Handle
The Cup and Handle is a bullish continuation pattern that signifies a period of consolidation followed by a breakout. It happens rarely but is usually followed by a strong upward move.
Key Characteristics of This Bullish Pattern
The Cup and Handle pattern has two main parts:
- The cup — a bowl-shaped consolidation that looks like a rounding bottom,
- The handle — a smaller consolidation or pullback.
The pattern is confirmed when the price breaks out of the handle’s resistance line.
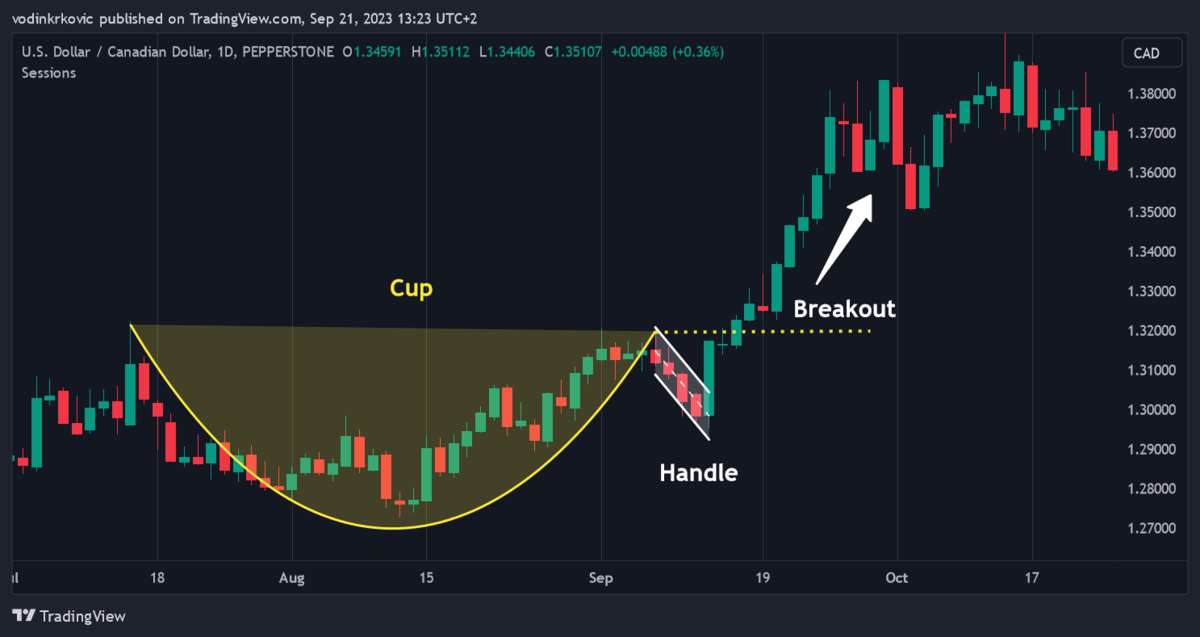
Entry and Stop Loss Points
Traders typically enter a trade when the price breaks out above the resistance line of the handle, or for more confirmation, after the price breaks out of the cup’s top.
A common place to set a stop loss is just below the lowest point of the handle. The expected upward move after the breakout is the same height as the depth of the cup.
Additional Insights
Volume typically decreases during the formation of the cup, increases at the end of the cup and beginning of the handle, and then decreases again during the handle. A significant increase on the breakout can provide additional confirmation.
5. Bullish Pennant Pattern
The Bullish Pennant is a continuation pattern that signals a brief consolidation before the price continues in the direction of the existing upward trend.
Recognition and Shape
The Bullish Pennant pattern has 2 parts: the flagpole and the pennant.
The flagpole is a strong, sharp, nearly vertical price surge (often a single big green candle), while the pennant is a period of consolidation that forms a small symmetrical triangle.
The pattern is completed when the price breaks out of the pennant area and continues upwards.
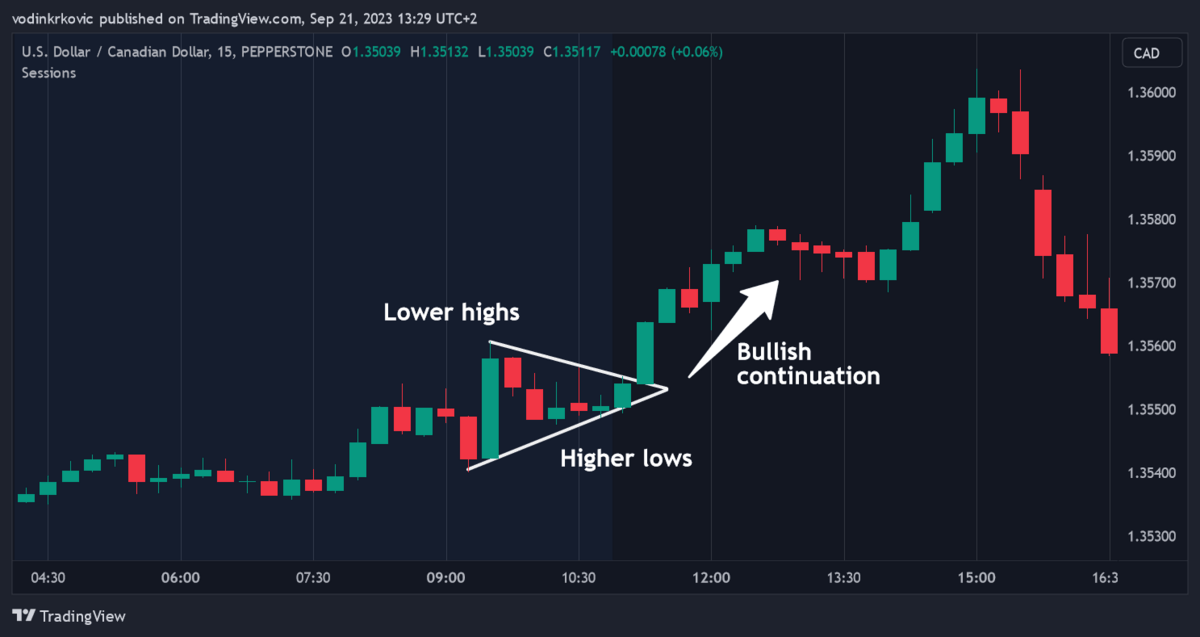
Entry and Stop Loss Points
A good potential entry point is when the price breaks out above the upper trendline of the pennant.
A common place for a stop loss is just below the beginning of the lower trendline of the pennant.
The expected upward move is the same height as the flagpole.
Additional Insights
Since this is a continuation pattern, considering the wider trend is key as that can help inform you whether the upward move will be strong or weak.
For example, if the price is above the 200-day simple moving average (on higher time frames) and if the RSI is above 50 when the breakout occurs, it could indicate that the coming trend continuation will be strong.
Also, seeing a volume spike on a volume indicator helps you confirm that the breakout is real and won’t reverse immediately.
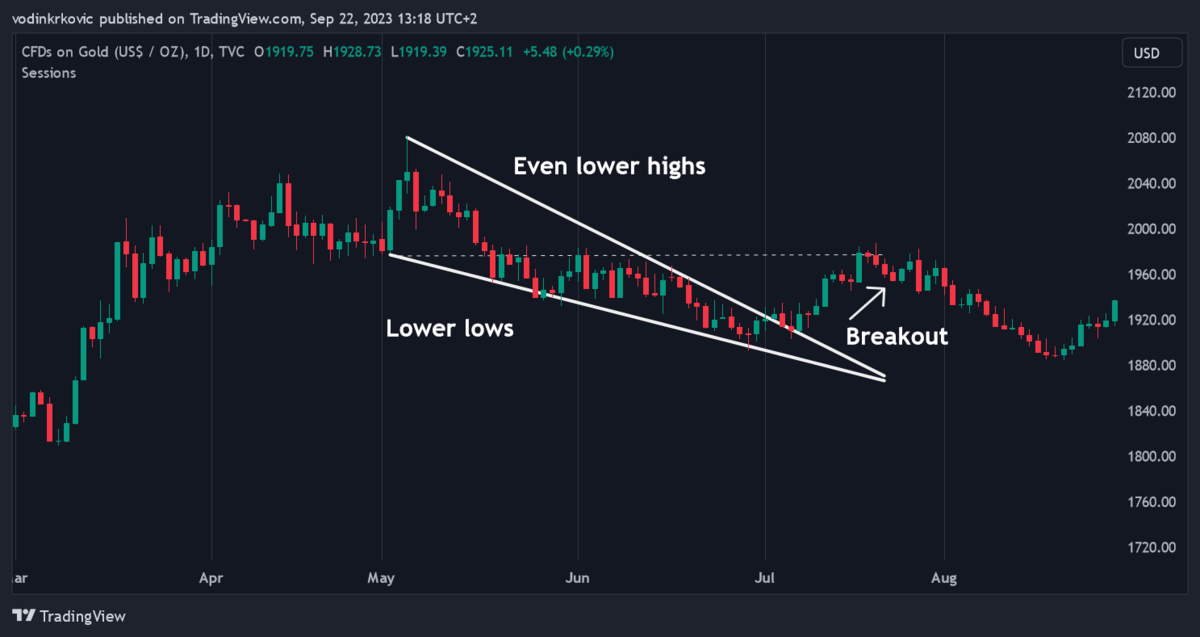
6. Bullish Wedge Pattern
The Bullish Wedge, a.k.a. the Falling Wedge, is a bullish reversal pattern that usually forms after a downtrend.
This pattern suggests that the sellers are becoming weaker and that the price is likely to break out to the upside.
Key Characteristics of This Bullish Pattern
The Bullish Wedge has two converging trendlines. Both are slanted downward, but the upper line is more so.
The upper trendline is formed by connecting lower highs, and the lower trendline is formed by connecting lower lows.
The pattern is confirmed when the price breaks out above the upper trendline.
Entry and Stop Loss Points
The common entry point is after the breakout above the upper trendline.
A common place for a stop loss is just below the most recent swing low within the wedge.
The expected upward move in price after the breakout is typically the same height as the start of the lower trendline of the wedge.
Additional Insights
Volume usually decreases during the formation of the wedge and increases during the breakout. Additionally, some traders estimate a price target by measuring the height of the pattern at its widest point and extending that distance upward from the breakout point.
Discover more great charts — Check out TradingView for free.
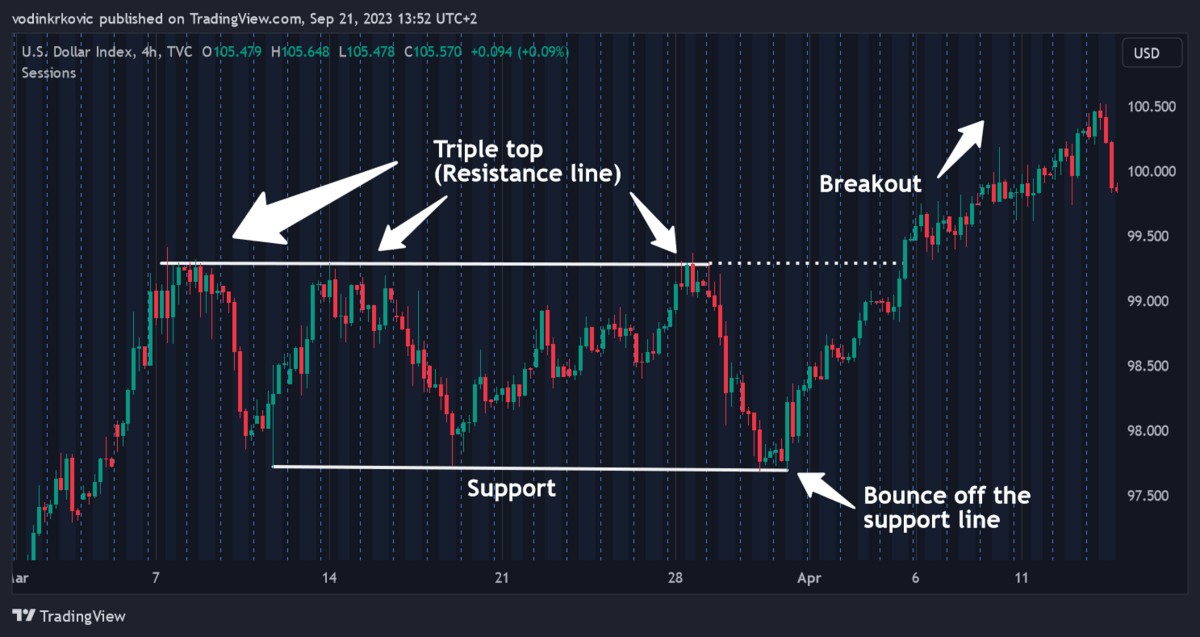
7. Triple Top Breakout Pattern
The Triple Top Breakout is a bullish reversal pattern that forms after a period of consolidation or range-bound trading.
This pattern suggests that a very strong resistance has been broken and a new uptrend is likely to continue until the price finds a new strong resistance level.
Key Characteristics of This Bullish Pattern
The Triple Top Breakout pattern is identified by three distinct peaks at approximately the same price level.
The pattern is confirmed when the price breaks out above the resistance level formed by the three peaks.
Entry and Stop Loss Points
Traders typically enter after the breakout above the 3 peaks.
A common place to set a stop loss is just below the most recent low within the pattern.
The common price target is a previous strong price level above the 3 peaks — ideally, a previous support or resistance level that the price bounced off from multiple times.
Additional Insights
Volume can provide additional confirmation of the Triple Top Breakout pattern. Volume typically decreases during the formation of the pattern and increases during the breakout.
Additionally, some traders set a price target by measuring the height of the pattern and extending that distance upward from the breakout point.
Candlestick Stocks: What Makes Candlestick Charts So Great?
Almost all traders prefer candlesticks over other chart types.
Why? Simply, candles give you more information to base your trades on. But they can also be a detriment to some traders.
Advantages of Candlestick Charts:
- Detailed Information: Each candlestick represents the open, high, low, and close prices for a specific time frame, offering more information than a simple line chart.
- Immediate Insight: The color and shape of the candlestick can immediately provide insight into the market’s sentiment. For example, a long bullish (green or white) candlestick indicates strong buying pressure.
- Pattern Recognition: You need candles to spot certain chart patterns. For example, the Bullish Engulfing, Hammer, and Morning Star are just a few of many candlestick patterns that can give traders an edge.
- Fractal Market Structure: By lowering your chart’s time frame, you can “zoom in” and get a clearer view of the price action. For example, on a 1-hour chart, a candle represents an hour of price action — on a 5-minute chart, that same candle will be split into 12 candles, showing you more detailed price action.
Potential Downsides of Candlestick Charts:
- Subjectivity: While candlestick patterns can be powerful, they can also be subjective. Different traders might interpret the same pattern in slightly different ways.
- False Signals: It’s possible for a candlestick pattern to suggest a potential reversal or continuation, only for the market to move in the opposite direction.
- Time Frame Sensitivity: The reliability of a candlestick pattern can vary based on the time frame. For example, a pattern that appears on a daily chart might be more significant than the same pattern on a 5-minute chart.
What are Bullish Signals?
Bullish signals are all data that points toward a potential upward price movement.
This includes data from:
- Technical Indicators: For instance, a moving average crossover (when a short-term moving average crosses above a long-term moving average) can be a bullish signal.
- Price Action: A higher low in price, even without a specific pattern, can be considered a bullish signal.
- Volume: An increase in buying volume can be a bullish signal.
- Chart patterns: Together with other signals, chart patterns are powerful predictors of price movement.
This is why traders never rely on one type of signal to make a trade — combining multiple signal types gives you higher probability trading opportunities.
Pro tip: In stock trading, news is one of the most significant signals, both bullish and bearish. If you’re looking for an accessible news source to help your trading, check out Benzinga Pro’s real-time news.
Benzinga Pro’s highly customizable news feed incorporates Benzinga’s active newswire, which publishes 50–60 articles on trading developments per day. There’s also a paid feature that is great for active traders – BZ Signals, which feed-delivers alerts on tradeable chart signals in all sorts of categories, like price spike, halt/resume, block trade, and more.
Best of all, when you use the link below, you can try Benzinga risk-free for 14 days.
What is the Most Bullish Candlestick Pattern?
Obviously, we cannot call any individual candlestick pattern the “most bullish.”
However, there is one that is fairly common in bullish uptrends and indicates a continuation — it is called the Three White Soldiers pattern.
As it shows there is strong buying pressure and very little selling pressure in the market, it can also confirm a trend reversal from bearish to bullish.
Here is an example:
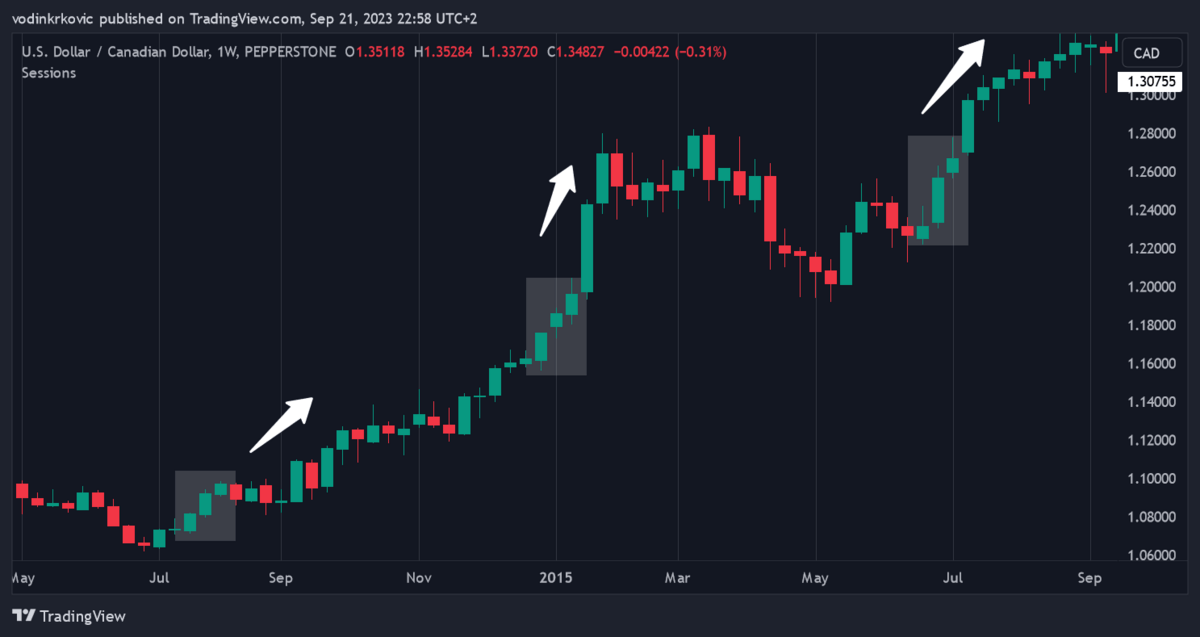
This pattern consists of three consecutive long-bodied candles with higher closes.
Each of these candles opens within the body of the previous candle and closes higher than the previous candle, indicating a strong bullish sentiment.
FYI: One of the easiest ways to be more profitable in trading is to sign up with a high-quality broker. Check out eToro if copy trading and crypto are in your game plan.
eToro securities trading is offered by eToro USA Securities, Inc. (“the BD”), member of FINRA and SIPC. Cryptocurrency is offered by eToro USA LLC (“the MSB”) (NMLS: 1769299) and is not FDIC or SIPC insured. Investing involves risk, and content is provided for educational purposes only, does not imply a recommendation, and is not a guarantee of future performance. https://www.wallstreetzen.com is not an affiliate and may be compensated if you access certain products or services offered by the MSB and/or the BD.
Bullish vs Bearish
So what is the difference between bullish and bearish patterns except the direction of price movement?
Nothing, for the most part.
In almost all cases, bullish and bearish patterns are just mirror images of each other. For instance, the Bull Flag has an upward-pointing flagpole and a downward flag, while the bear flag pattern is the opposite. Here’s an example of the Bear Flag pattern:
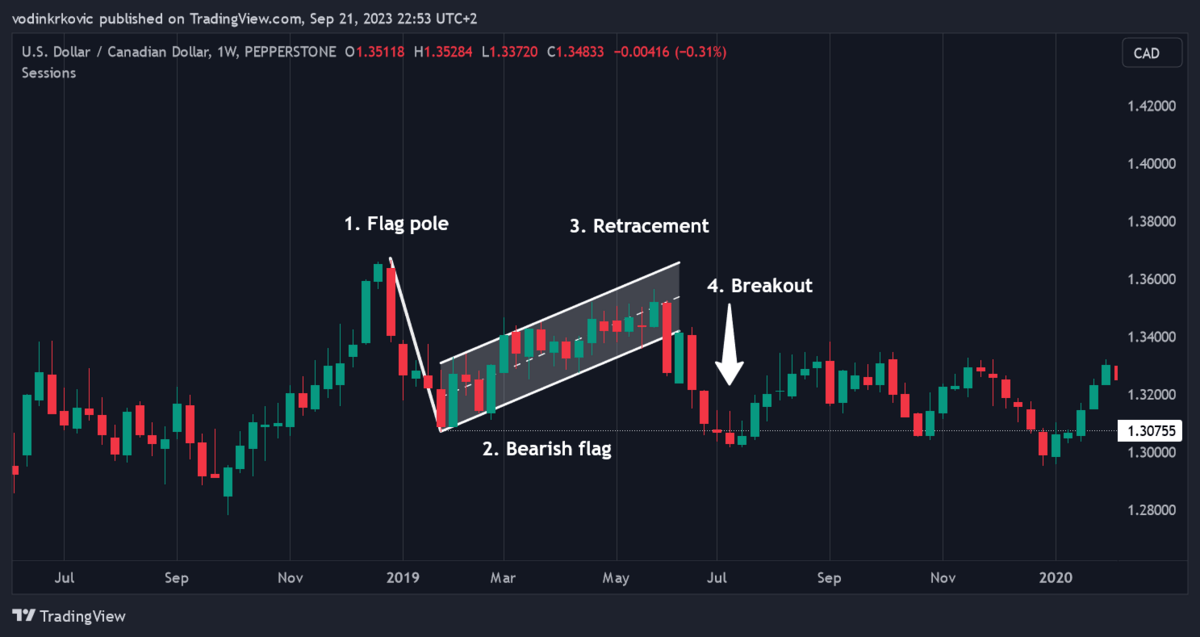
However, market context means a lot. For example, if you saw a bullish pattern yesterday followed by a huge uptrend and you see a bearish version of the same pattern today, that doesn’t mean the result will be the same.
Depending on the wider context, price action, market structure, overall sentiment, etc., the new bearish pattern might even be a fake one.
Tip: Don’t worry if all of this seems complicated or confusing — in general, day trader training takes 1 – 3 years. If you are serious about going on that journey, consider completing one of the most recommended day trading courses around at Investors Underground.
Final Word: Bullish Patterns
- A bullish pattern is like a rain forecast — you never know if it will rain for sure, but if it says 90%, you’d better be prepared.
- To improve your odds of success, stick with tried-and-true bullish patterns and combine them with other bullish signals like indicators, volume, and price structure.
- No pattern works all the time, but trading with them will help you stack the probabilities in your favor and increase your overall profitability.
FAQs:
What Are Bullish Patterns?
Bullish patterns are certain shapes that a candlestick chart often takes before an upward price movement. No pattern is a guarantee of a bull run but they often correctly indicate a certain market sentiment and serve as high-probability price movement signals.
What is the strongest bullish pattern?
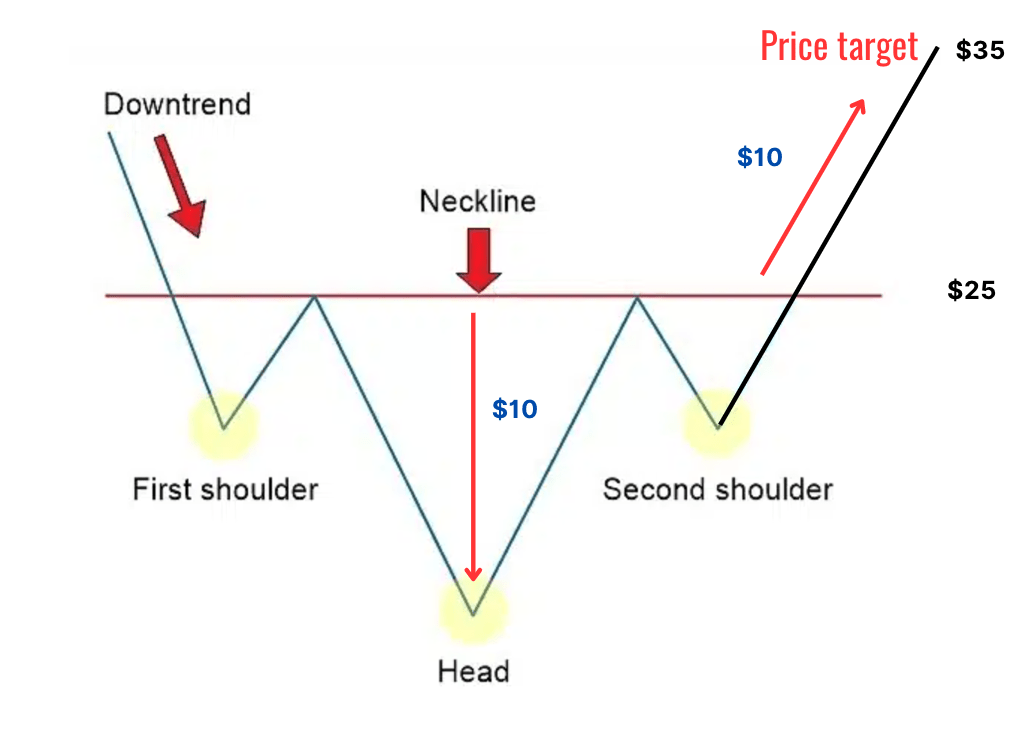
According to a top researcher of chart patterns, Tim Bukowsky, the inverse head and shoulders pattern is the strongest pattern with an 89% success rate. However, this is the result he got from the specific data set he used. Your experience may be different.
How do you identify bullish stock movement?
Identifying bullish market movements involves looking for bullish signals such as buying volume, bullish chart patterns, bullish readings on technical indicators, and upward price action.
What Does a Bullish Trend Look Like?
A bullish trend features higher highs and higher lows. As a security’s price swings upward, as long as each swing low and high is higher than the previous one, the price is in an uptrend. Once that pattern is broken, it’s called a “break of structure,” which could indicate a reversal.
Where to Invest $1,000 Right Now?
Did you know that stocks rated as "Buy" by the Top Analysts in WallStreetZen's database beat the S&P500 by 98.4% last year?
Our July report reveals the 3 "Strong Buy" stocks that market-beating analysts predict will outperform over the next year.