Jessie Moore has been writing professionally for nearly two decades; for the past seven years, she's focused on writing, ghostwriting, and editing in the finance space. She is a Today Show and Publisher's Weekly-featured author who has written or ghostwritten 10+ books on a wide variety of topics, ranging from day trading to unicorns to plant care.
If you’re interested in swing trading or day trading, you need access to a solid charting platform.
Charting platforms give you the ability to save your trading setups, analyze multiple charts at once, and consolidate trading data into a single platform. Putting these tools to work can help you validate your trade ideas, which can ultimately lead to fewer losses and more winning trades.
StockCharts.com is a popular platform for traders that has a limited number of tools available for free, more for a fee. But is it worth it? Can it help you become a better trader?
In this Stockcharts com review, you’ll learn all about the platform’s charting tools, features, pricing, research, and educational resources. You’ll also learn how it compares to another top-rated charting platform so you can figure out which one is best for you.
StockCharts is good … but TradingView is better.
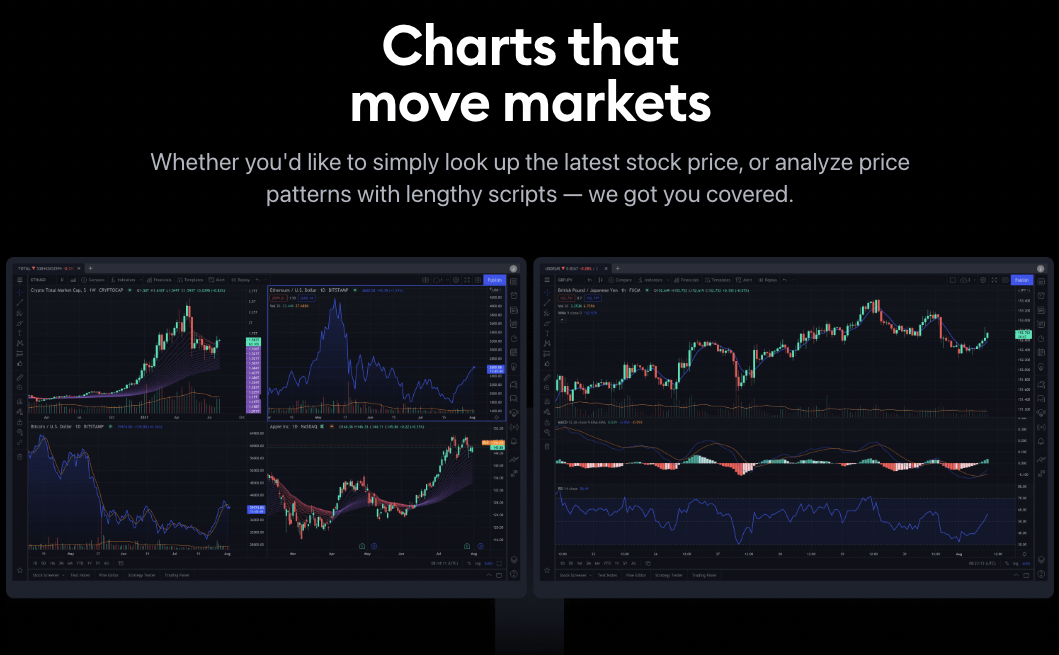
For investors and traders who need access to real-time data, TradingView is the clear winner.
Not only does this powerful platform feature a user-friendly interface, advanced charting tools, and real-time data across multiple asset classes…
But you also get customizable indicators, drawing tools, and social features. Simply put, it’s loaded with features that make it a top pick for both newbies and professionals.
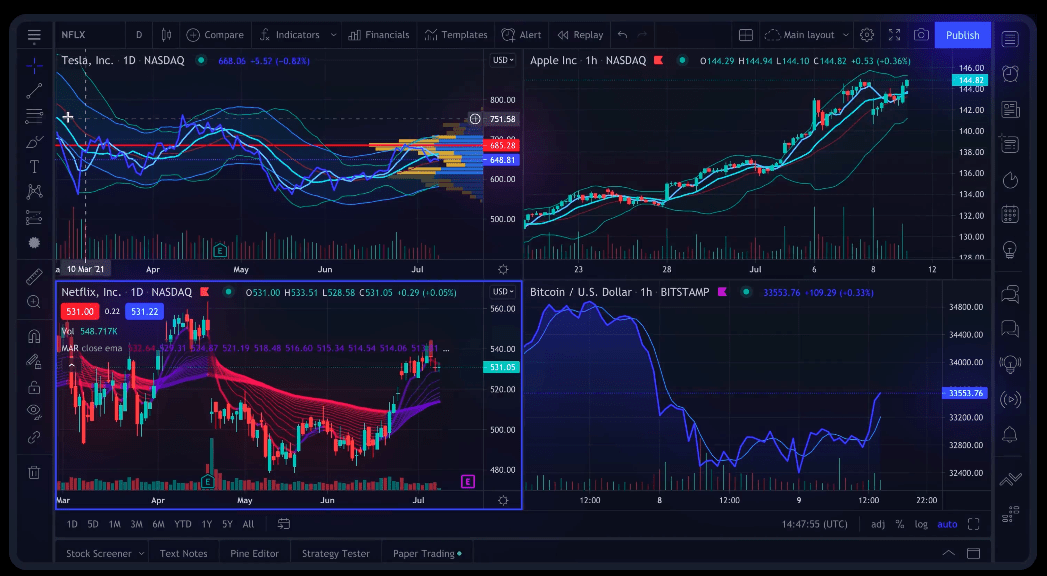
Plus, here’s a smart feature: Since TradingView is a cloud-based platform, you get seamless access from any device, giving you more flexibility to research stocks how and when you like. Check out TradingView today.
StockCharts Review: Is It Free? Is It Worth It in 2026?
The Bottom Line: StockCharts is a comprehensive charting platform that offers a wide selection of unique charts and customizable scans and alerts for experienced traders.
However, StockCharts.com only has one chart that delivers real-time data, and you need to upgrade to a paid account to unlock it.
For that reason, it may be best suited to swing traders and longer-term investors. Active day traders might be disappointed in the platform’s limitations and non-interactive charts and will likely be happier with TradingView (check out our full TradingView Review).
Keep reading our Stockcharts review to get the full details below.
StockCharts Features:
Charts
Stockcharts.com has a large selection of different types of charts. There are many free options, with more customization available for paid accounts.
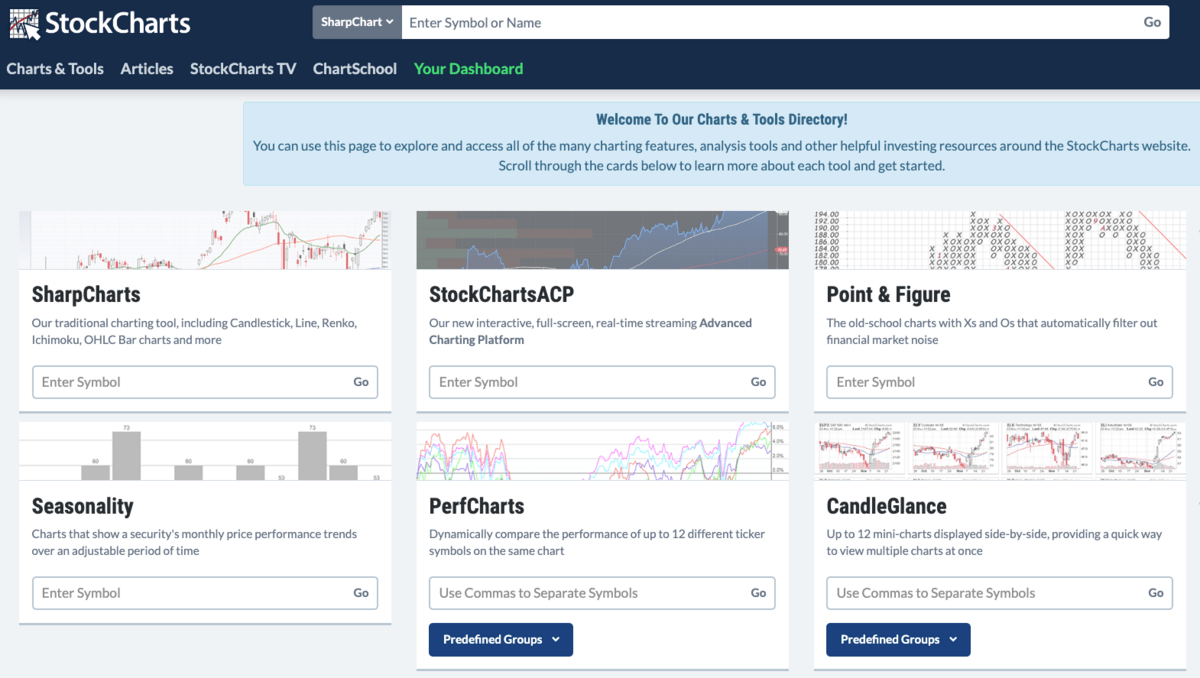
There are 10+ different types of charts available, including:
- SharpCharts
- StockChartsACP
- Point & Figure
- PerfCharts
- CandleGlance
- Seasonality
- GalleryView
- MarketCarpets
- RRG Charts
- Dynamic Yield Curve
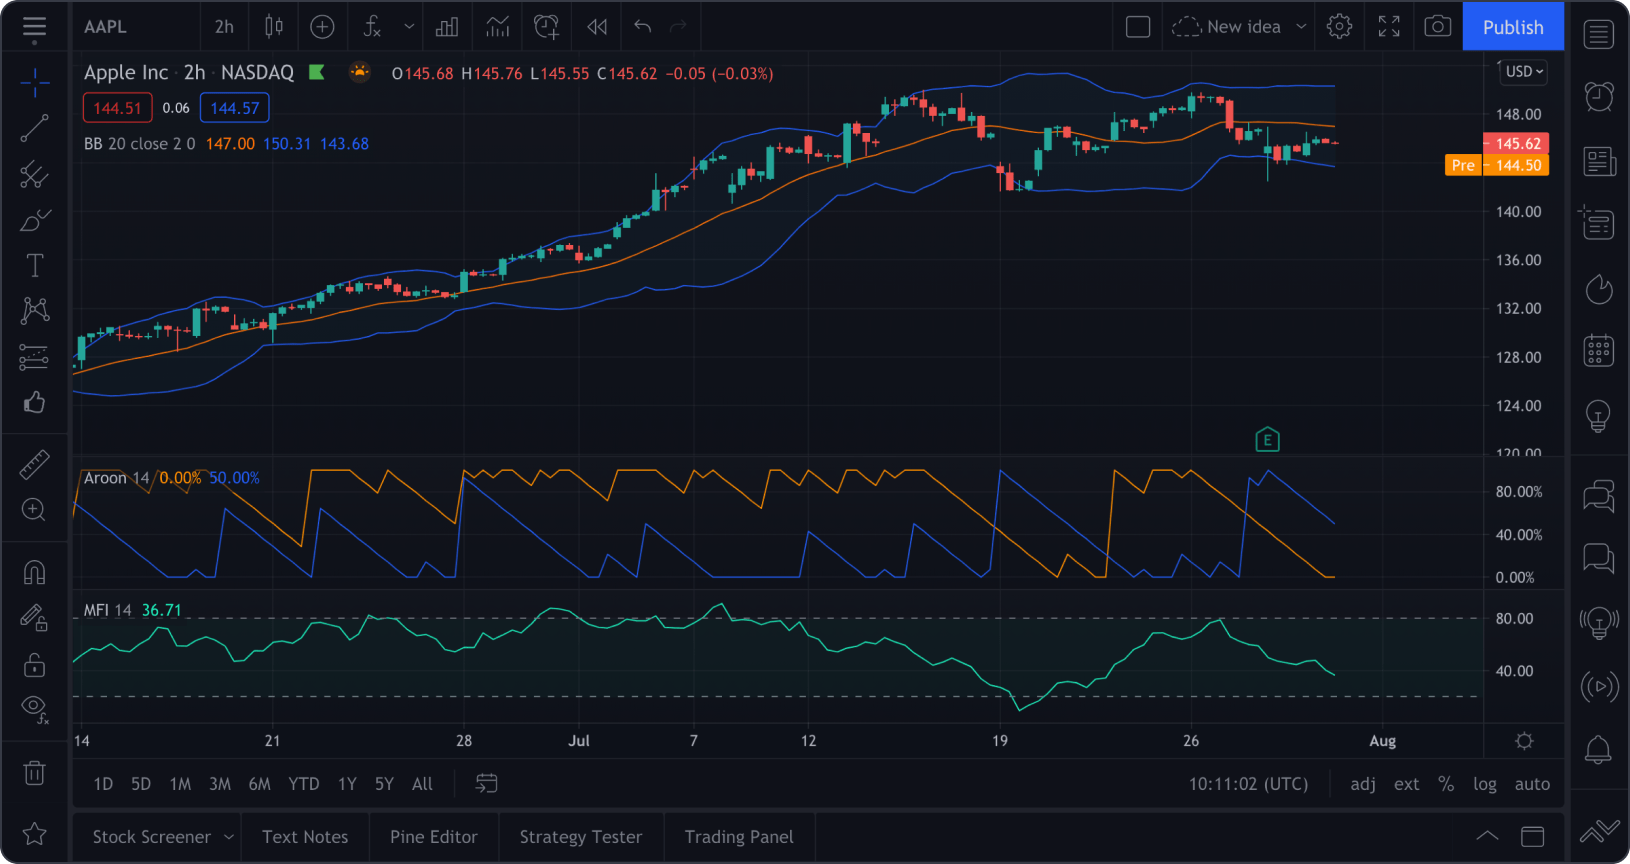
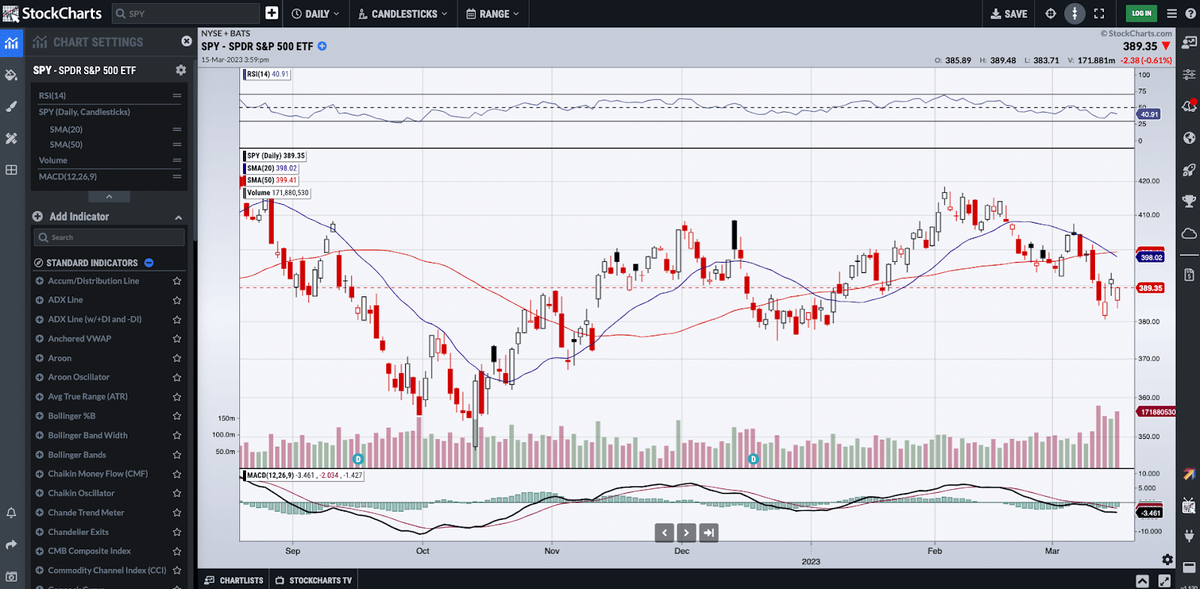
StockChartsACP is one of the more interesting features — a highly-detailed interactive chart with dozens of indicators and real-time streaming data. Since most of the other charts are simply pictured-based and not interactive, this is a major upgrade for active traders.
You can access daily and weekly candlesticks and up to five years of historical data on the free chart, but you will need a paid plan for the minute chart and up to 100 years of historical data.
You can also trade directly within the chart thanks to a partnership with the Tradier brokerage. It is still not the best active chart out there (TradingView is still king!), but it’s a good option for fans of this platform.
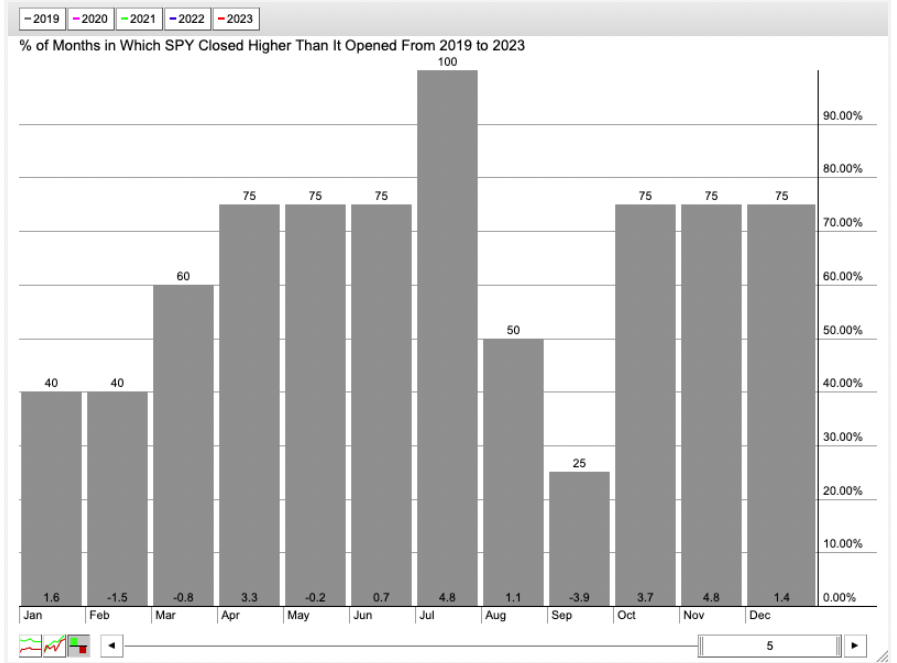
Also, the Seasonality charting is helpful to see a security’s price over the course of time and identify seasonal pricing patterns.
For finding general entry/exit points (used by swing traders and long-term investors), this is perfect.
You can see a monthly breakdown over a five-year period of time showing how often a stock closes higher at the end of the month than it opened:
The Dynamic Yield Curve chart shows the relationship between a given security in comparison to interest rates. You can quickly find out the rate sensitivity of an investment to help inform your trading strategy.
Some of the charts look a bit “old school” in their design, but the information can still be valuable.
Dashboard
The Stockcharts.com Dashboard is fully customizable. It shows you a summary of the market as well as your selected panels, so you can focus on your current trades and watchlists.
Here’s what you’ll find on the dashboard:
- Market Overview
- Data Panels (select up to 4)
- Sector Summary
- Market Movers: Top 10 Lists
- SCTR Reports
- Ticker Cloud
- Predefined Alerts
- DP Scoreboard Signals
- ChartList Panels
- Chart Panels (select up to 3)
- Your Scans
- Your Alerts (shows up to 5)
- Commentary Panels
- Your ChartLists
You can customize your view. That way, you can zero in on the charts and data you want to see.
Of note: the sector summary shows the performance of all 11 U.S. market sectors at a glance, making it a quick way to see how each sector is performing. From there, you can quickly click through to the top-performing stocks in each sector.
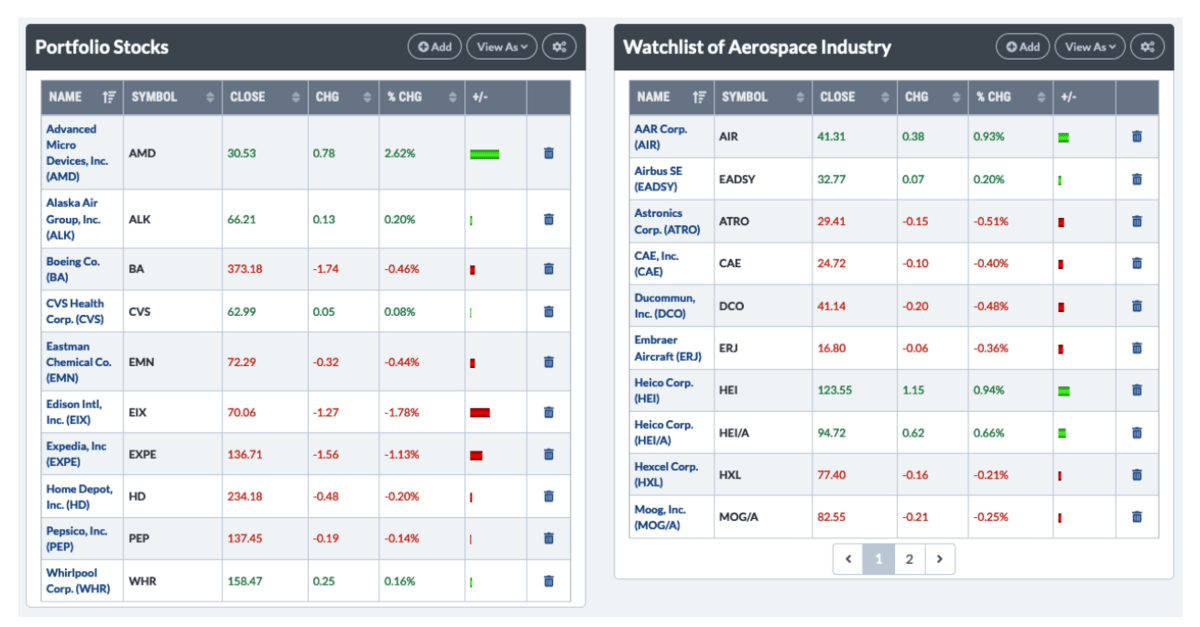
The Chart Panels are helpful in showing you an update on your current top three stocks. But since they only show SharpCharts, the data is not truly real-time (there’s a delay). This can lead to missing sudden market moves, especially on stocks with high volatility.
While this is helpful at a glance (and perfectly fine for swing traders), you’ll want to open an ACP chart for the stock for more up-to-date information if you are day trading.
And I want to point out that the commentary panels are just the latest articles on the Stockcharts.com blog — not an industry news feed.
Stock Scanner
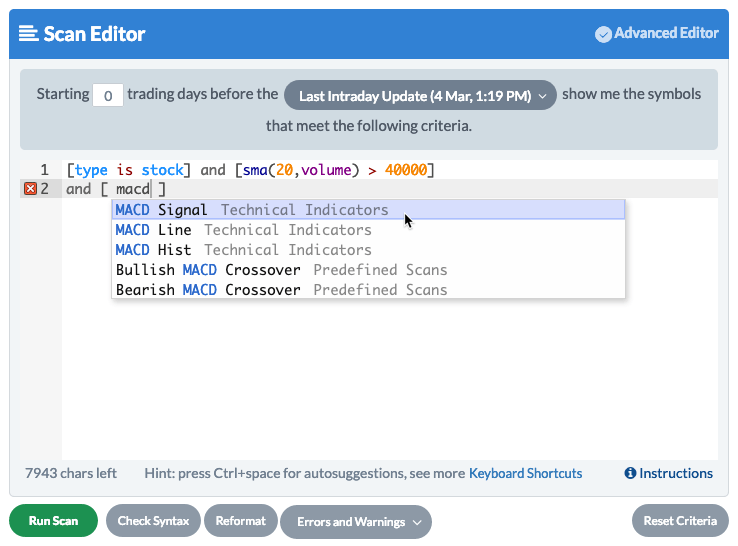
The StockCharts scanner is unique in the industry, but can also be very confusing to new users who don’t have advanced knowledge of stock screening. It is syntax-based, meaning you can write your own screening criteria, and essentially you can code in custom scans.
The scanner can also be set up as custom alerts, so you’re notified when a stock meets your scanning criteria over email, SMS, or on your dashboard. But if you’re new to stock scans, it’s a good idea to start by watching the training videos in the education library. More on that below…
Other Features
Here are some of the other features you’ll find (and some you won’t):
- Stockcharts.com offers an online school for learning about trading called “ChartSchool.” It includes helpful articles and videos on how to understand the different types of charting tools, as well as trading strategies.
While it’s mostly an organized summary of help articles on the site, it’s fairly useful. The technical analysis articles will help any new trader learn a lot about trading with advanced charting.
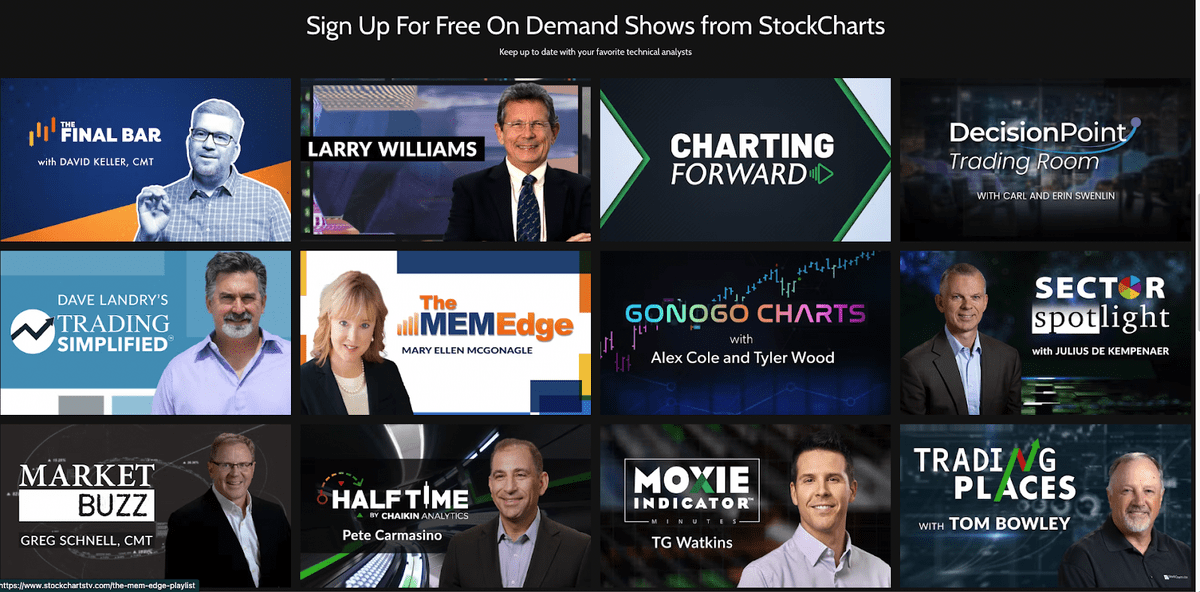
- While there is not a lot offered in the way of third-party research and data, you can tune into StockChartsTV to watch commentary and analysis from experts like Tom Bowley, David Keller, Larry Williams, and others.
It is streaming 24/7 and gives you insights into the market and current market news stories. There is also an On Demand feature so you can watch at your leisure.
- As for a feature you won’t find, there is no stockcharts app. That means StockCharts is best for desktop users and not mobile traders.
Who is StockCharts Best For?
StockCharts.com is not for everyone. With very little real-time charting and no stockcharts app, active day traders may be better off with TradingView.
However, StockCharts.com is fairly easy to use and does have tools on the platform that may benefit certain types of traders and investors:
Swing Traders
If you’re a swing trader, you don’t need to stare at the 1-minute chart. Rather, you need enough data for a clear strategy on a long-term trade. Since you don’t necessarily need access to real-time charting, StockCharts could be a great fit because of its customization and unique charting views.
Plus, if you’re a swing trader, the ability to custom-code your own scans can help you keep on top of the market in a more automated way.
Most swing traders can use the free version of StockCharts.
Long-Term Investors
If you’re a long-term investor and more interested in market trends and long-term positions than short-term trades, StockCharts.com could be a valuable tool.
With 10+ charting types, dozens of overlays, and customizable scans, long-term investors have plenty of tools to get a zoomed-out view of the market and search for value investments.
All long-term investors can use the free version of StockCharts.
If you’re an active day trader looking for the best charting platform, check out our TradingView Review.
StockCharts Pricing
StockCharts.com offers free charting directly on its website. But if you want to save any settings or have access to more charting tools, you’ll need to upgrade to a paid account. There is a free one-month trial available for any level, which lets you unlock all of the abilities of the platform for a limited time.
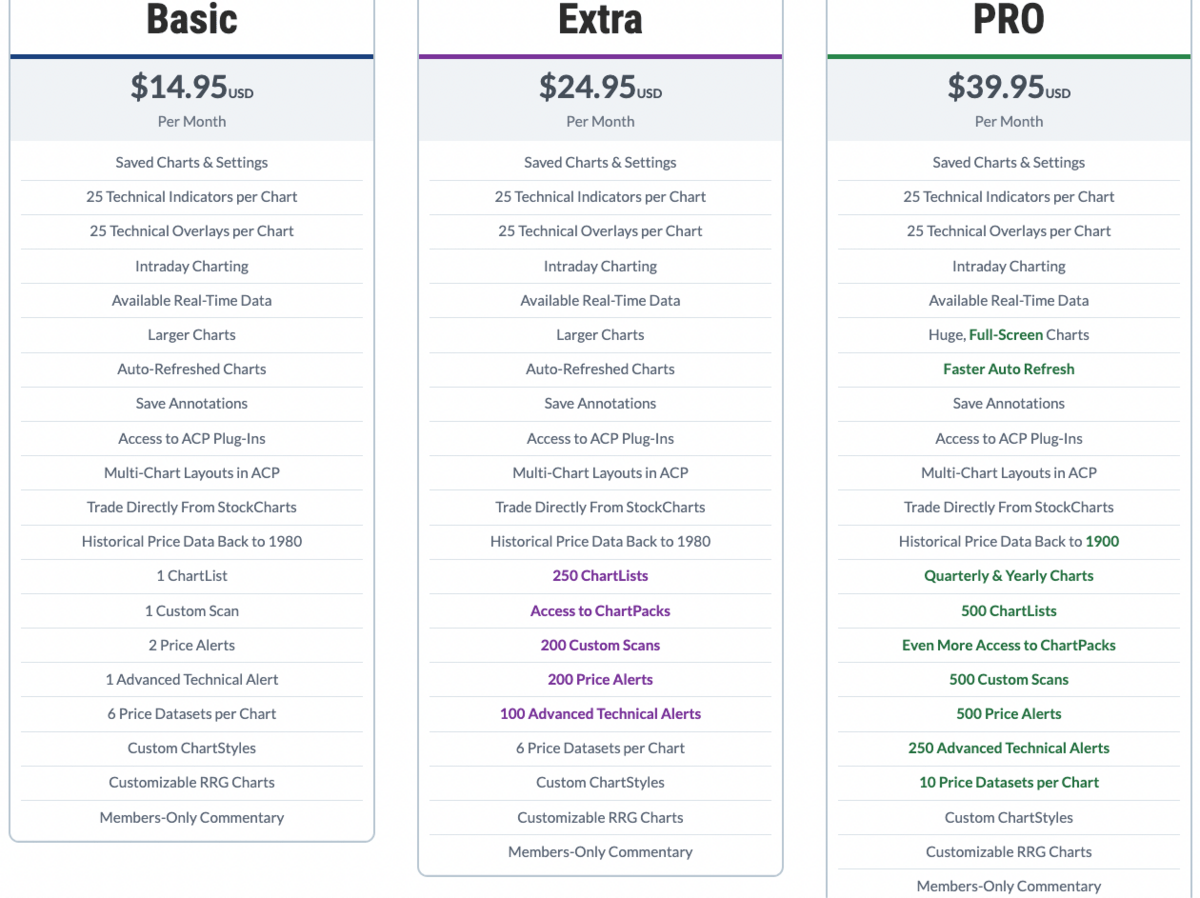
There are three pricing tiers available, each offering a different level of detail and tools. Here’s a breakdown of StockCharts pricing:
Basic ($14.95 per month): The basic plan allows you to save your charts and settings, access 25 indicators and overlays per chart, and create custom alerts. This base-level access is best for investors with a narrow focus.
Extra ($24.95 per month): For an additional $10 per month you can get access to 250 chart lists (versus just one), 200 custom scans, and 100 advanced alerts (versus just one).
PRO ($39.95 per month): For $15 per month more than the “Extra” plan, you get a lot more, including quarterly and yearly charts, 500 ChartLists, 500 price Alerts, and 10 Price Datasets per chart. Plus the auto-refresh time is cut down to only a few minutes.
StockCharts Free vs StockCharts Premium
Is StockCharts free? Yes, there is a free version. However, the free version is really more of a trial version that lets you preview the platform.
You can’t save anything, which is not useful for building a trading strategy. You can see all of their charting types and play with indicators and overlays, but that’s about it.
StockCharts premium plans give you full access to the platform, a customizable dashboard, more up-to-date data, and the ability to save your settings and favorites. The higher-tiered premium plans allow for more customization and alerts, and more detailed charting and scans.
Overall, while StockCharts free version can help you validate an idea, actually executing it requires access to the StockCharts premium version, which isn’t a huge deal if you’re a swing trader or long-term investor looking for more general entry/exit points.
Pros and Cons of StockCharts
Pros | Cons |
|---|---|
Access to free charting tools | Limited access to real-time data |
Seasonal, Yield Curve, and Multi-view charts available | Most charts are not interactive (pictured-based) |
Custom code scan criteria | Free version loaded with display ads |
Customizable alerts via SMS or email | Fewer indicators and overlays than competitors |
StockCharts vs TradingView: Which One Is Best?
StockCharts.com is best for quickly finding entry/exit points for swing trades and longer-term opportunities for fundamental investors. If you fall into one of these camps, the free version of StockCharts will probably be sufficient.
TradingView, on the other hand, is the top charting platform available, with hundreds of charting tools and access to interactive charts with real-time data.
TradingView gives you free access to real-time data, a slick desktop and mobile charting interface, and the ability to track your favorite assets with ease. The paid versions of TradingView offer a similar value, but you can add in quite a few more alerts at the entry-level (at the same $14.95/month price), and a more modern interface.
To sum it up, StockCharts.com is more appropriate for long-term investors. If you’re an active trader, TradingView is the hands-down winner.
Final Word: StockCharts Com Review
As this StockCharts com review demonstrates, the platform offers some charts that are unique in the industry, plus the benefit of easy access — you don’t need an account to check them out.
With a huge library of tutorials and 24/7 market analysis available, you can build a decent trading strategy with this platform alone.
However, StockCharts is really not suited for day traders. While it does have one real-time chart (the ACP chart), you’ll need a paid plan to unlock full features. Plus, the platform’s interface is dated, you can’t save charts without a paid plan, and there are fewer indicators than the competition.
If you are a swing trader or long-term investor who wants to validate your trades quickly, StockCharts.com is a great platform. If you are an active trader who needs access to up-to-the-minute data and mobile charting, this may not be the best platform for you.
Check out our TradingView Pro Review.
FAQs:
What does StockCharts com cost?
StockCharts offers a free plan, and three different paid plan options: Basic, $14.95 per month; Extra, $24.95 per month; and PRO, $39.95 per month. There is a free one-month trial available for all plans, but you will need to provide a credit card to sign up.
Which is better StockCharts or TradingView?
Based on our analysis, TradingView is a better overall charting platform than StockCharts. While the free charts on StockCharts.com offer a quick way to validate your trades, it lacks real-time data and requires a paid plan to save any settings.
TradingView has a well-designed user interface and a fantastic mobile app. There’s a reason most professional trading platforms integrate with TradingView — it’s the best charting platform around.
What is the best website for StockCharts?
StockCharts.com is a popular website for access to free charting and the ability to share your favorite setups that is a go-to resource for swing traders and investors that want to validate trade ideas quickly.
Another popular charting website is TradingView.com. It also offers free charting resources, with a focus on real-time data and a modern interface. TradingView also offers a mobile app for tracking your trades on the go.
Is there a free version of StockCharts com?
Yes. StockCharts.com allows you to access and view 10+ types of charts for free. However, more features and capabilities are available with paid accounts.
Where to Invest $1,000 Right Now?
Did you know that stocks rated as "Buy" by the Top Analysts in WallStreetZen's database beat the S&P500 by 98.4% last year?
Our May report reveals the 3 "Strong Buy" stocks that market-beating analysts predict will outperform over the next year.