Lincoln is an investor and content marketer. He has worked for financial advisors, institutional investors, and a publicly-traded fintech company. Lincoln holds degrees in Finance, Economics, and Accounting.
The best charting app & broker for ascending triangle patterns…
If you’re looking for a stock charting app, there’s a good chance that you’re also looking for a broker. TradeStation has the best free charting software on the market – and if its proprietary charts aren’t enough for you, it integrates fully with TradingView! That means you can use TradeStation for your broker and make trades directly from a TradingView chart.
But TradeStation’s in-house charts shouldn’t be overlooked. Its custom-built tools include:
- Chart Analysis – a multi-function window where you can look up price data, perform technical analysis, back-test and automate strategies, and show orders and positions
- RadarScreen – one of the most specced-out stock screeners available, featuring alerts and real-time watchlists with 329 criteria built in
- Matrix – this takes all of the tools typically featured alongside charts (a market depth window, buy and sell signals, and an order-entry tool) and puts them into one window
Sign up for TradeStation here.
Technical analysis can be overwhelming. Complex, jargon-filled articles can leave you with more questions than answers.
But it doesn’t have to be that way.
When distilled down to their essential elements, most patterns and concepts are straightforward and easy to understand, like ascending triangle patterns.
You’ve probably heard about them before, but maybe you don’t truly know what they are and how to leverage them in your trading.
Skip the complicated walkthroughs. I’ll show you exactly what this charting pattern looks like, what it implies, and, importantly, how to use the bullish ascending triangle to make profitable trades.
What Is an Ascending Triangle Pattern?
An ascending triangle is a type of price action pattern, a chart of security’s price movement over time. Ascending triangles are a continuation pattern, meaning they can be used to help confirm if the price of a security, like a stock, will continue moving in its current direction.
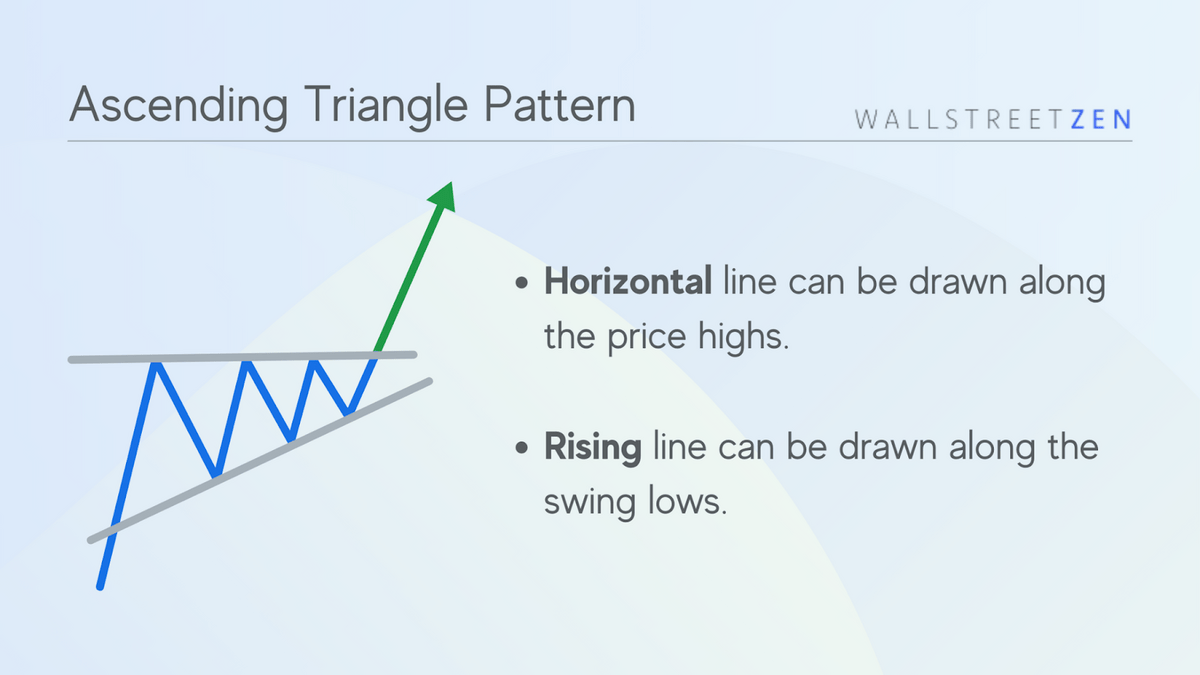
An ascending triangle pattern is produced when a horizontal line can be drawn along the highs of a price chart, and an upwards-sloping line can be drawn along the price lows.
Ultimately, the pattern is intended to provide traders with price entry points, stop-loss levels, and profit targets.
Ascending triangle patterns work off the assumed psychology of investors. When buyers compete to purchase stocks, share prices increase. As the price rises, fewer interested buyers enter the market, until the price ultimately peaks.
This price peak occurs at the horizontal line, called the resistance level. Then, the price begins to decrease until it reaches the bottom support level.
Since it’s ascending, the bottom horizontal line is tracking new higher lows.
This pattern continues until the bulls take over and the stock resumes its upward trend.
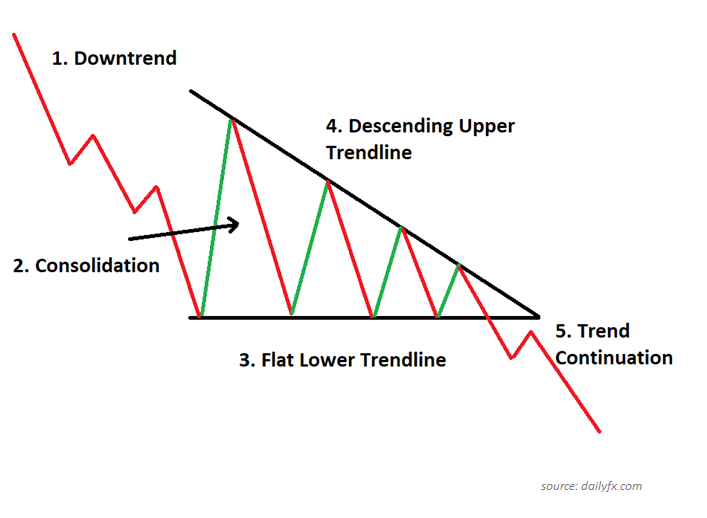
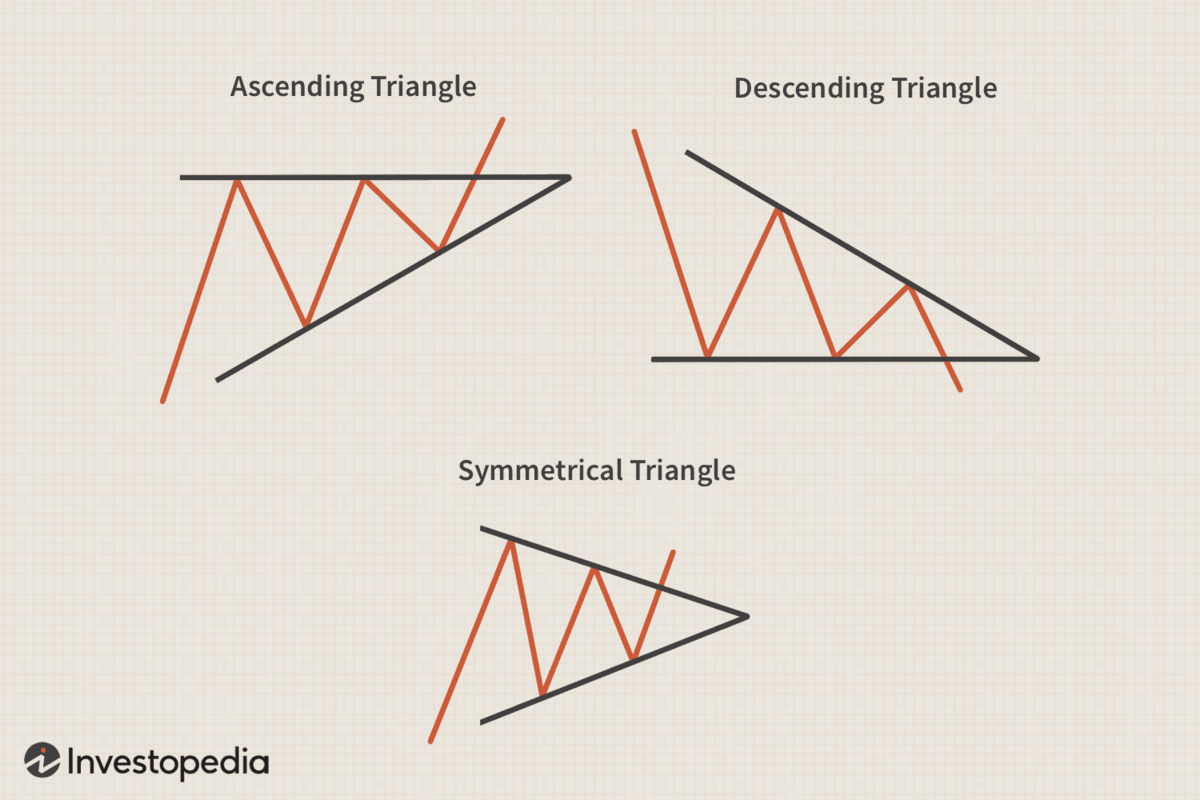
Alternatively, a descending triangle pattern would see increasingly lower highs (downward sloping), while at the same time, you could draw a horizontal line across the lows. The is the key distinction between ascending vs descending triangles.
An ascending triangle pattern represents an uptrend, while a descending triangle pattern represents a downtrend.
Stock pattern triangles can be either bullish, bearish, or even neutral.
- An ascending triangle chart pattern is considered bullish.
- A descending triangle is considered bearish.
- A symmetrical triangle (highs sloping down and right coupled with lows sloping up and right) is considered neutral.
Once a trader has confidently identified what they believe to be an ascending triangle pattern, the next step is to monitor the price for a breakout.
A breakout through the resistance levels gives the trader an opportunity to buy shares and go long, participating in the upside. If the price breaks out below the diagonal support line, the trade should not be taken.
You might be interested in Investors Underground, a day trading community with exceptional educational materials.
IU offers 3 trading courses with a track record of transforming brand-new traders into full-time trading professionals.
The Components of an Ascending Triangle Chart Pattern
An ascending triangle chart pattern is comprised of the following:
- Pricing chart for a security that includes at least two highs and two lows.
- Horizontal trend line along the swing highs.
- Rising trend line along the swing lows.
How to Trade an Ascending Triangle
A stock pattern triangle provides one of three potential signals:
- A stock (or any security) is expected to continue to rise in price. This is what most traders using the ascending triangle are looking for, so they can buy the stock at the breakout above the resistance line.
- A stock is expected to lower in price.
- A stock is expected to maintain its current price (no clear signal indicating the security’s price is expected to increase or decrease.
Once traders have at least two highs and two lows, lines can be drawn on a chart to discover whether a stock pattern triangle is forming. In theory, the more data points present, the more reliable the signal.
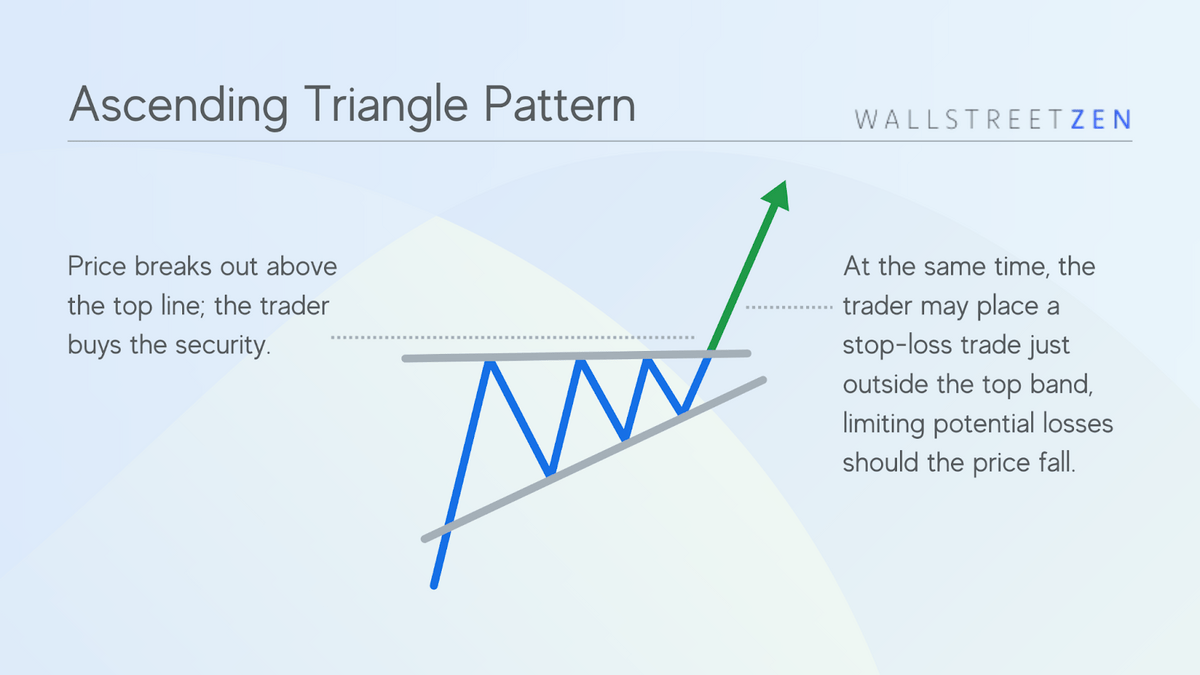
After establishing an ascending triangle pattern, traders will wait for a breakout above the resistance line and buy the stock at that point.
The trader might also consider coupling the long position with a stop-loss trade just outside the top trendline, limiting potential losses. In this case, the stop-loss trade would sell the stock if it fell to a specified price.
While ascending triangle patterns are typically regarded as bullish signals, this is not always the case.
According to this charting philosophy, if the price breaks out the bottom line from above, this may imply the stock price will likely continue to fall in the short term. In this case, a trader may decide to short the security to benefit from the fall in price.
Whether shorting or going long, how long should you maintain your position?
Typically, proponents of this technical tool calculate price targets by adding or subtracting the height of the thickest part of the triangle to or from the breakout point.
For example, in the chart below the price eventually breakouts below the support line from above. Accordingly then, the price will continue to fall, but to what depths?
In this example, the height of the widest portion of the triangle is roughly $20 ($280 less $260). The $20 provides a rough approximation of how much further the price could fall.
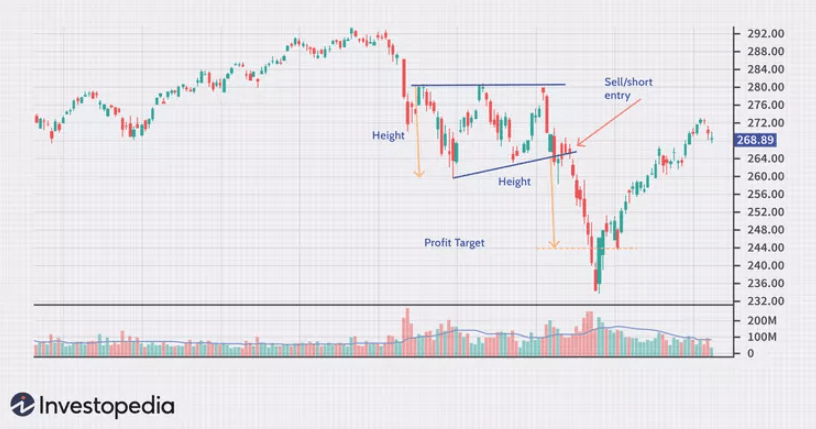
So, if this trader decided to short this stock with the expectation it would continue to drop in value, they might similarly exit the short once the price is around $240 per share.
Stock Market Guides helps traders find specific stock setups with a backtested edge by pairing technical signals with historical performance data. Each scan shows how similar setups have performed in the past, making it easier to filter for high-probability trades with confidence.
Pros and Cons of Trading an Ascending Triangle
Pros | Cons |
|---|---|
Even without breakout signals, you can trade within the stock pattern triangle. | Based on assumptions of price movements that may not occur. |
Simple to learn, easy to execute. | Can deliver false breakout signals leading to poor trade decisions. |
Profit targets can be calculated. | The price might move sideways rather than within the bands of the ascending triangle chart pattern. |
How Reliable Is a Bullish Ascending Triangle Pattern?
Like all technical patterns, an ascending triangle pattern is meant to provide insight into the potential future movements of a security. While these patterns may have predictive power, nothing is guaranteed.
Ascending triangle patterns, therefore, offer insight into the likely direction of a stock.
Most sophisticated traders don’t rely on this signal alone. Instead, an ascending triangle pattern might be combined with other indicators when making a trading decision.
An ascending triangle bullish pattern built with only two highs and two lows might be considered less reliable than one built with ten peaks and ten troughs. Typically, more data points are considered more predictive.
Ultimately, each trader decides what confidence they attach to the signal and whether further data is needed to support a position.
📈 Ready to go beyond pattern recognition?
Spotting a chart pattern is one thing — knowing how to build a full technical analysis strategy around it is another. Coursera’s technical analysis courses cover:
- Reading and interpreting price action
- Combining patterns with volume and momentum indicators
- Risk management for chart-based trading
Taught by industry practitioners and university faculty.
Final Word: Ascending Triangle Chart Pattern
Ascending triangle chart patterns offer a potentially potent tool that traders can use in their analysis. It leverages investor psychology and the understanding of historical price movements to help make intelligent investing decisions.
This particular charting pattern has the benefit of clear entry points, price targets, and stop-loss levels that many traders find valuable and reassuring. Still, just because the model can produce exact price points doesn’t necessarily mean they’ll ultimately be correct or beneficial to pursue.
Ascending triangle chart patterns should be viewed as effective tools that are far from perfect. From this perspective, they should be considered as part of a wider investment analysis process.
FAQs:
Is an ascending triangle bullish or bearish?
An ascending triangle pattern is bullish.
While an ascending triangle chart pattern can sometimes provide bearish signals, they are largely considered bullish formations because they’re uptrend continuation patterns.
How reliable are ascending triangles?
An ascending triangle chart pattern can offer a reliable indicator of future price movements. While far from a silver bullet in predicting the future, it can offer investors directional insight that helps build conviction in a trade decision.
What is a descending vs. ascending triangle?
A descending triangle formation occurs when price highs are increasingly lower, but price lows are consistent. As a result, a downward-sloping line can be drawn across the highs, while a horizontal line can be drawn across the lows.
This contrasts with ascending triangle formations that occur when price lows are increasingly higher, with price highs relatively unchanged.
Is a descending triangle pattern bullish or bearish?
A descending triangle pattern is bearish. A descending triangle pattern is a continuation pattern - since the price is trending down, a descending triangle implies further bearish movement.
Where to Invest $1,000 Right Now?
Did you know that stocks rated as "Buy" by the Top Analysts in WallStreetZen's database beat the S&P500 by 98.4% last year?
Our July report reveals the 3 "Strong Buy" stocks that market-beating analysts predict will outperform over the next year.