Jessie Moore has been writing professionally for nearly two decades; for the past seven years, she's focused on writing, ghostwriting, and editing in the finance space. She is a Today Show and Publisher's Weekly-featured author who has written or ghostwritten 10+ books on a wide variety of topics, ranging from day trading to unicorns to plant care.
When it comes to day trading, everyone wants a cheat code.
Sorry, they don’t exist. However, day trading chart patterns are the next best thing — and a tool that profitable day traders rely on. Day trade chart patterns indicate a heightened probability that the market or stock will swing one way or the other in the near future.
Of course, no pattern is ever guaranteed. The same pattern that worked 99 times might not work the 100th time. But if you want to be a day trader, you need to know the basics about common trade patterns.
In this article, I’ll share some of my favorite day trading stock patterns — including how to spot them, tips for how to enter and exit trades, and how to combine them with other indicators to improve your potential on every trade.
Opportunity knocks — er, squawks!
Stock moves don’t exist in a vacuum — they go hand in hand with the news cycle. Benzinga Pro provides an invaluable newsfeed that’s ideal for day traders due to its real-time newsfeed, audio squawk for live updates, and customizable stock screener that identifies trading opportunities.
Plus, the platform’s Movers Tool highlights stocks with significant price changes, while real-time alerts on price spikes and unusual activity help you make informed decisions. Additionally, it offers watchlists, alerts, and an intuitive interface for a seamless trading experience, enabling you to stay on top of market events and execute trades efficiently. Get started for FREE using the link below!
What are Day Trading Patterns?
Day trade chart patterns and technical analysis are based on the idea that historical price patterns tend to repeat.

The reason behind this repetition? Market participants tend to react to similar events and price movements in a similar manner. In short, human behavior is pretty predictable.
Day trading patterns don’t guarantee success. But they can give you a stronger likelihood of a win, especially when combined with other indicators.
Ready to learn? Let’s examine some of the most popular day trading patterns, complete with charts from some of the best online charting software out there — TradingView.
The Importance of Market Structure
Why does the overall market trend matter for day trading patterns?
Bullish or bearish chart patterns imply that the market has a trend. This is different from a “sideways” market — this is when the price is neither going up nor down and it is chaotically trying to consolidate or enter into a trend.
Knowing the market structure can help you “trade the trend” and determine whether to look for bearish or bullish day trading stock patterns.
As a rule of thumb, try to bet with the trend rather than against it. Betting on a downtrend while the market is in an overall uptrend can be dangerous, and vice versa.
Pro tip: Don’t trade sideways markets with these strategies! Only use them in markets with a distinct trend. A sideways market requires a different approach.
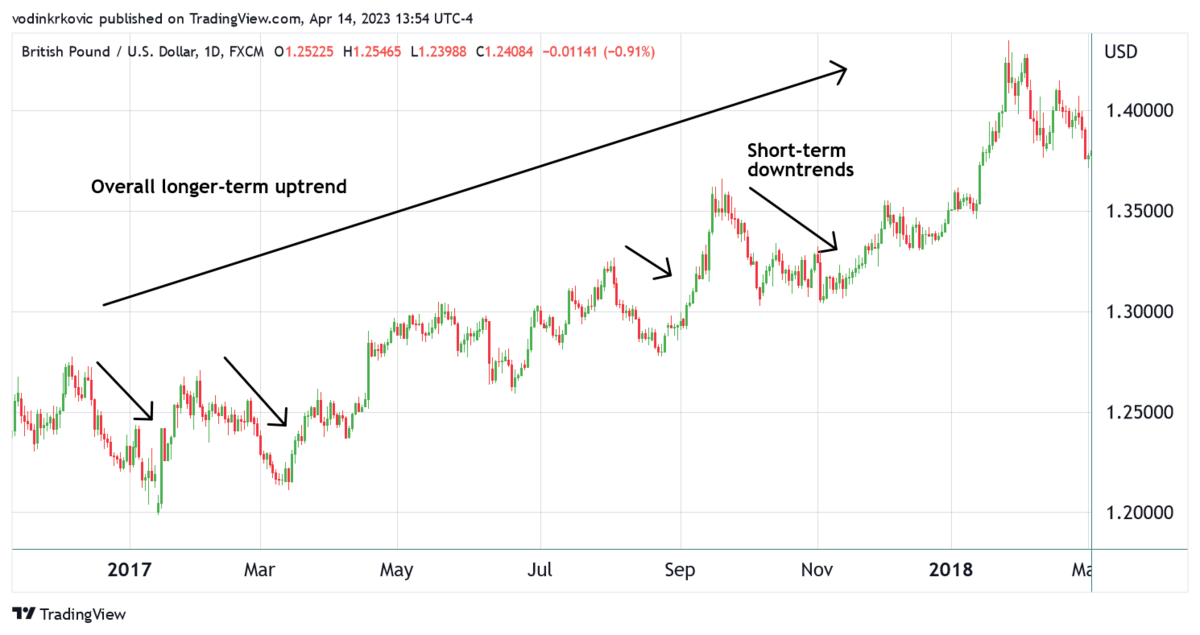
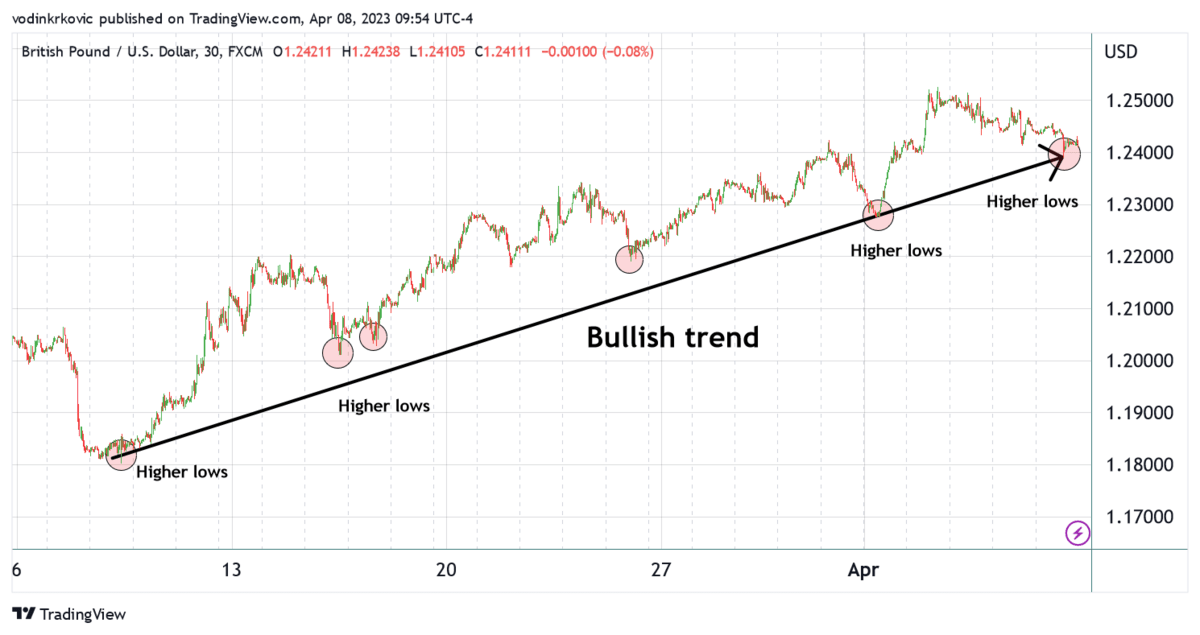
Identifying the Overall Trend Quickly
Here is a very simple way to identify the trend:
- Take a chart and zoom it out so you can see a few weeks or months in the past.
- See if the price line is trending upward or downward. Can’t tell? Add a simple moving average indicator to your chart to get a clearer picture.
- If the trend is bullish, circle all the lows. If it is bearish, circle all the highs.
- Try to draw a straight line that goes through all these circles. If the line touches 3 or more circles, the line can be considered a valid trend line.
- In a bearish trend, if the price is below the trend line, that means it is falling. If it is above the trend line, that means it is retracing so it can fall more later. The opposite is true for bullish trends.
Major trend reversals are very rare. Identifying the overall trend and following it with your trades can increase your potential to profit.
Once you’ve established what the longer-term trend is, you can look at the daily or weekly chart as a part of that larger trend.
For example, if you know there’s a bullish trend going on and the daily chart is moving downwards, you can look at this as a temporary retracement before a higher jump and wait for that opportunity to jump in.
Pro tip: To get an even clearer picture, identify a weekly trend, as well as a monthly trend. Many profitable traders only execute after they’ve found where the current price is in the context of a wider trend.
6 Common Day Trading Patterns:
Now that you can identify trends, here are six patterns to know — three each for bullish and bearish markets.
1. Bull Flag Pattern
The bull flag is a continuation pattern that signals a strong uptrend may resume after a brief period of consolidation.
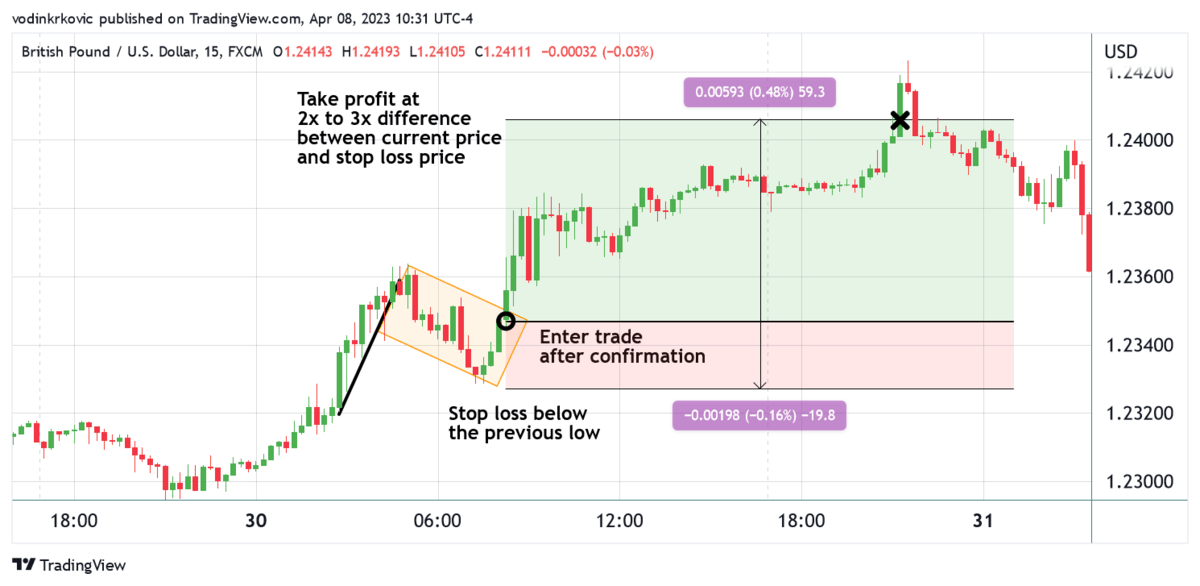
A bull flag day trading pattern appears when the price line goes up rapidly (the flagpole) and then consolidates (the flag). The consolidation typically takes the form of a downward-sloping rectangle — as you can see on the chart below, it forms a proper flag.
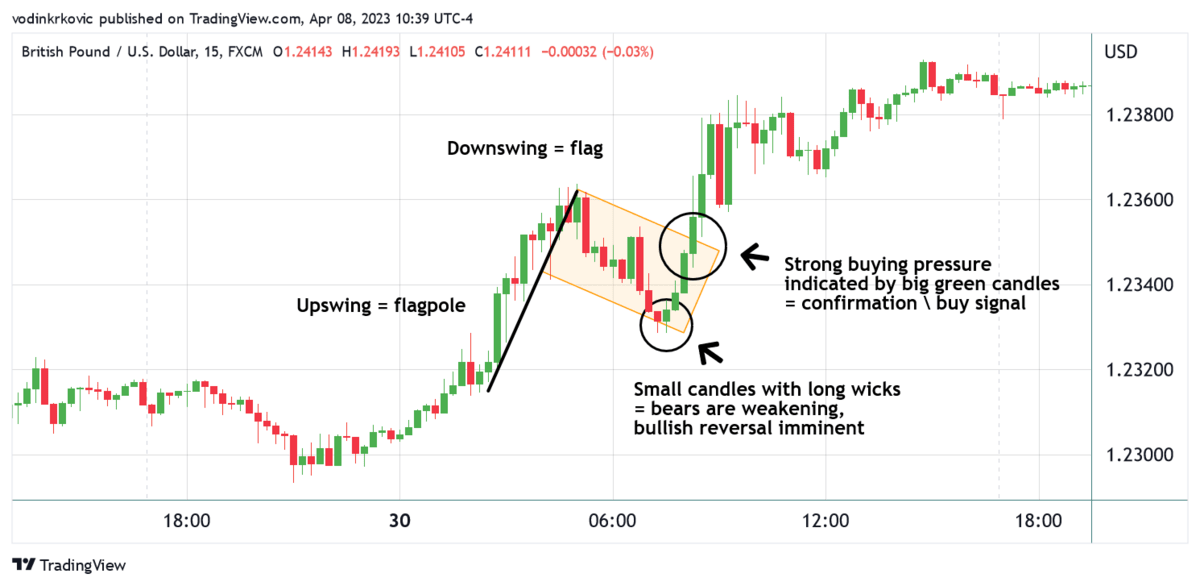
The bull flag pattern is considered to be a strong bullish signal because:
- The flagpole represents strong buying pressure or high demand for the asset.
- The consolidation phase is often seen as a pause in the uptrend, allowing traders who missed the initial move a better entry price.
- Volume usually decreases during the consolidation phase, suggesting the selling pressure is not strong enough to change the overall trend.
How to Trade the Bull Flag Pattern:
Here’s how many traders approach the bull flag pattern:
- Wait for a breakout above the upper trendline of the flag, ideally on increased volume. This breakout signals that the uptrend is resuming and provides an opportunity to enter a long position.
- Upon entry, set a stop-loss order just beneath the lowest point of the consolidation (you’re assuming that the price will push higher).
- Set the take-profit order equally above your entry point (at the very least) — the bull flag is very bullish and can indicate a much stronger jump if there is a lot of volume.
- If the price keeps consolidating just beneath your take-profit mark, consider raising your stop-loss order so you break even if the price swings downwards again.
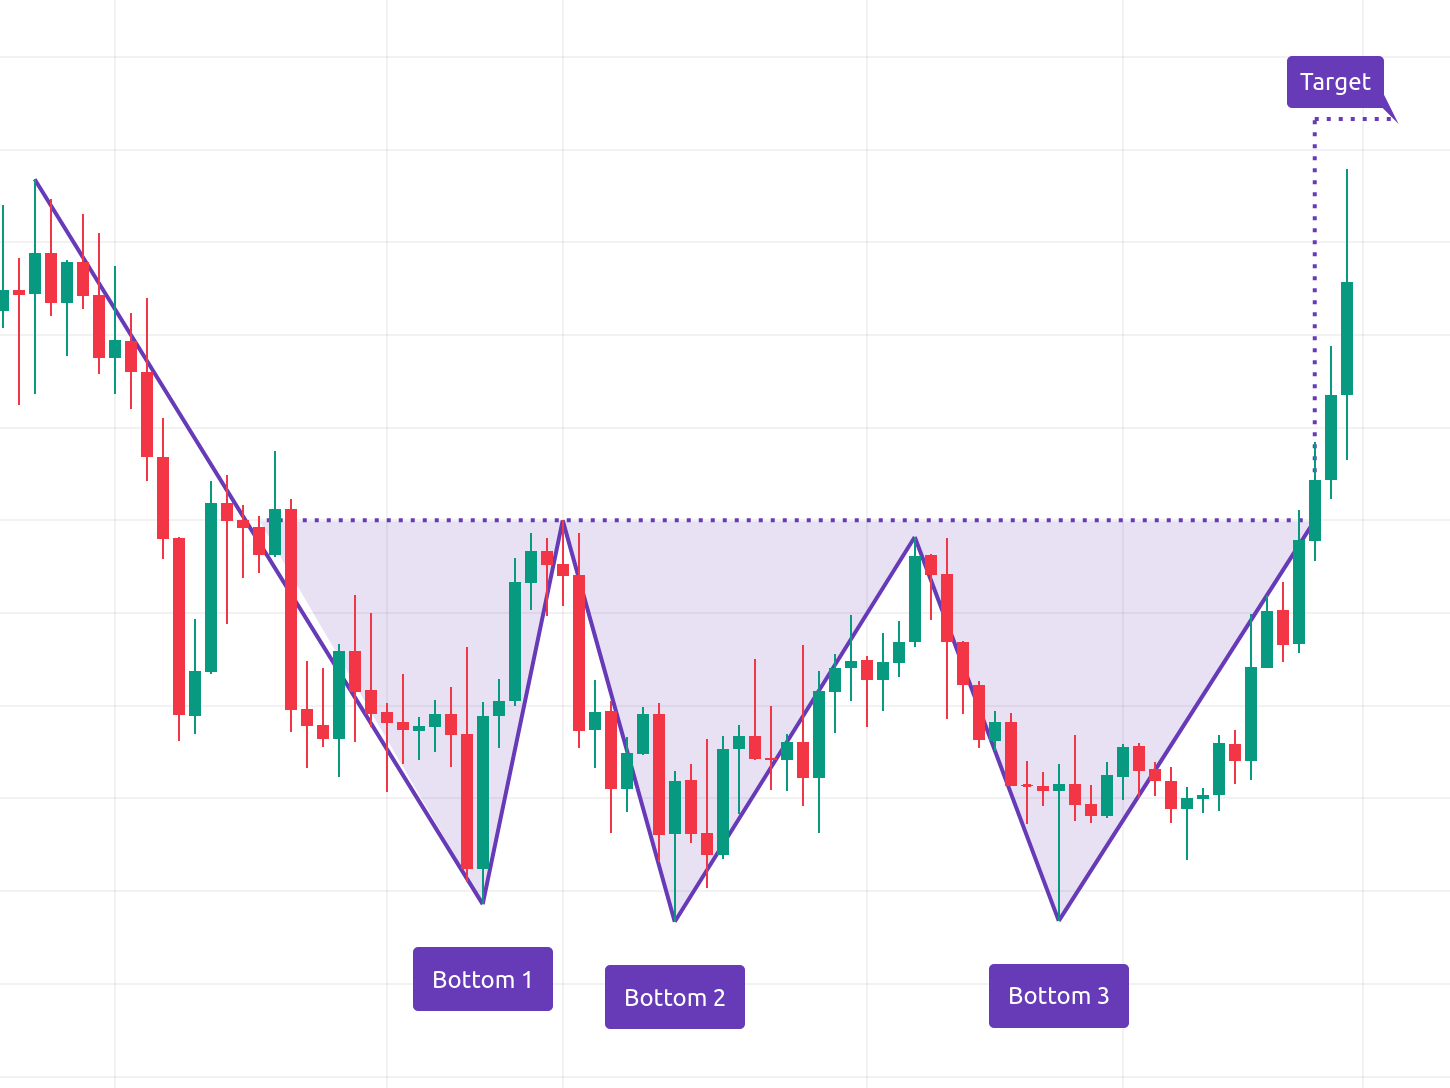
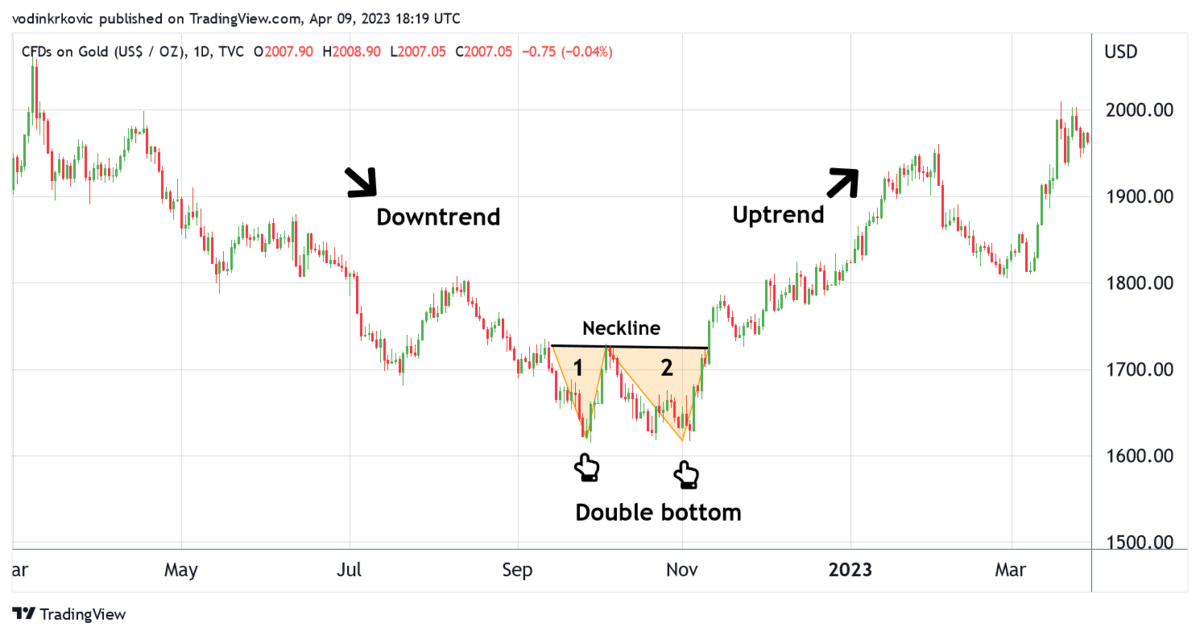
2. Double Bottom Pattern
The double bottom is a reversal pattern that signals a potential shift from a downtrend to an uptrend.
It’s characterized by two distinct troughs at approximately the same price level, separated by a peak in the middle. The pattern resembles the letter “W.”
Being one of the strongest bullish patterns, the double bottom can precede a strong and long uptrend, so it often pays to set a higher take-profit order, and wait.
The double bottom is considered a profitable bullish reversal pattern because:
- The two troughs in the pattern suggest that the selling pressure is unable to push the price lower than the initial bottom, indicating that the bears are losing control to the bulls.
- The price bouncing back up from the same level twice indicates strong buying pressure. This support level acts as a floor, preventing the price from falling further.
- The breakout above the neckline (on increased volume confirms the pattern and provides a clear buy signal. This breakout demonstrates that the bulls have taken control, and there may be enough buying pressure to push the price above the previous resistance level.
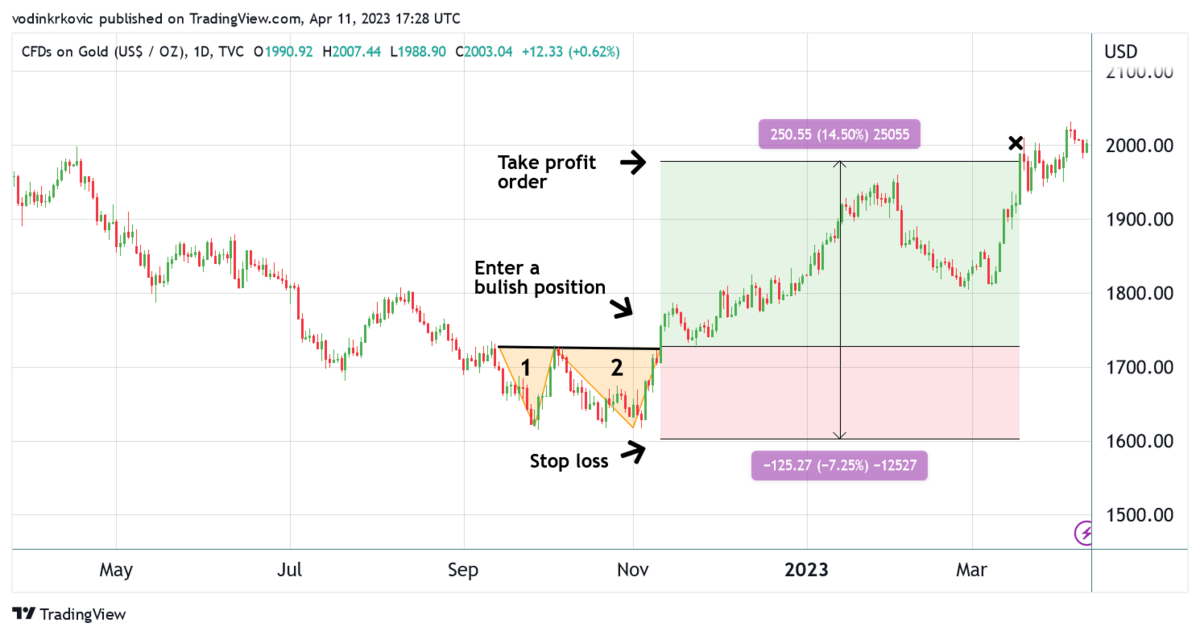
How to Trade the Double Bottom Pattern:
Here’s how many traders approach the double bottom pattern:
- Enter the trade when the price breaks above the necklike after the second thorough.
- Set a stop-loss just below the two thoroughs.
- Set a take-profit order that is equal to or higher than the distance between the neckline and the bottoms of the two thoroughs.
Love the charts in this article?
They’re all from our favorite charting platform — TradingView
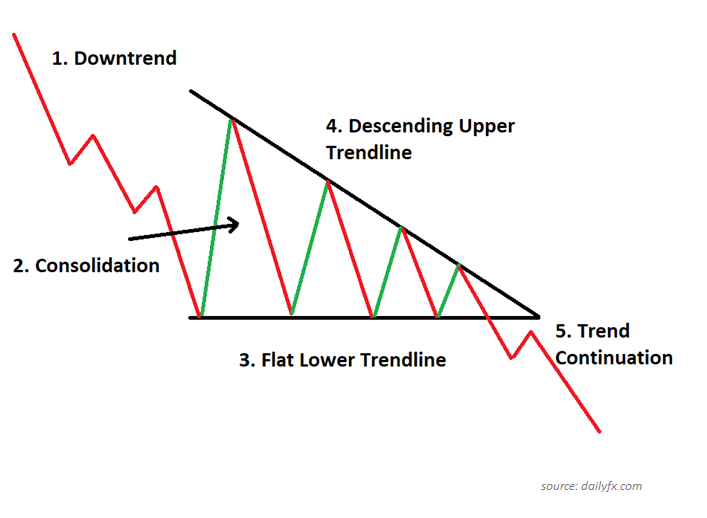
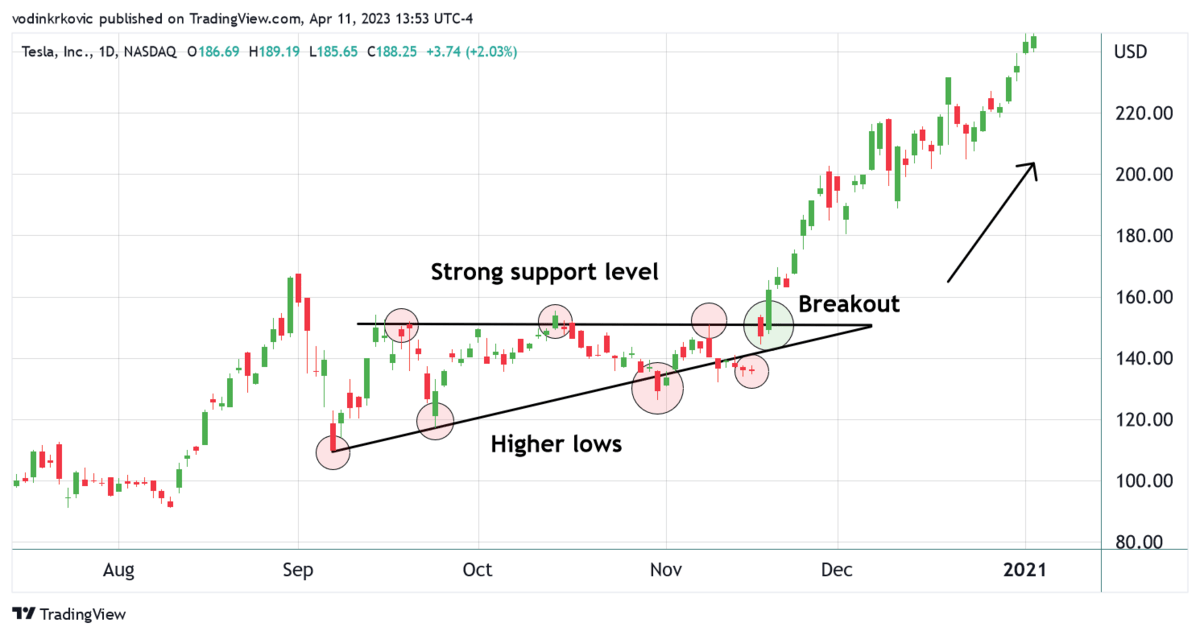
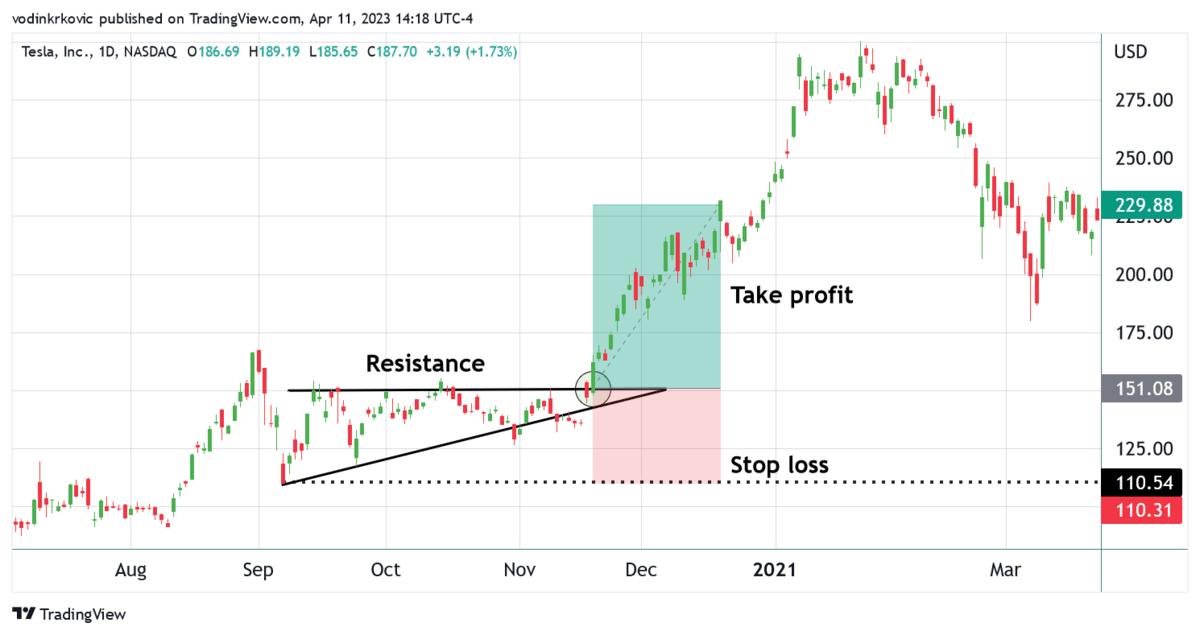
3. Ascending Triangle
When it comes to bullish signals, the ascending triangle is one of the most powerful ones out there. It can indicate both a reversal as well as a continuation of a bullish trend.
The ascending triangle consists of a stable resistance level and gradually higher lows. When the lows get very close to the resistance, it means that a breakout might be imminent.
The ascending triangle is considered a strong bullish signal because:
- The strong support level suggests that buyers are gaining strength, as they are willing to buy the asset at higher prices.
- The horizontal resistance represents a psychological barrier that can lead to buying pressure when broken.
- The breakout signal is very clear. As such, it calls buyers to action.
How to Trade the Ascending Triangle Pattern:
Here’s how many traders approach the ascending triangle pattern:
- Determine if the ascending triangle is a continuation pattern or a reversal pattern. The buying pressure is likely to be stronger if the market is in an uptrend on a longer time frame.
- Enter the trade when the price line breaks out above the resistance level — the higher the volume, the better.
- Set a stop-loss below the lower trendline or a recent swing low.
- Set a take-profit order above the resistance. The distance should be equal to the distance between the lowest low of the trendline and the resistance level or greater.
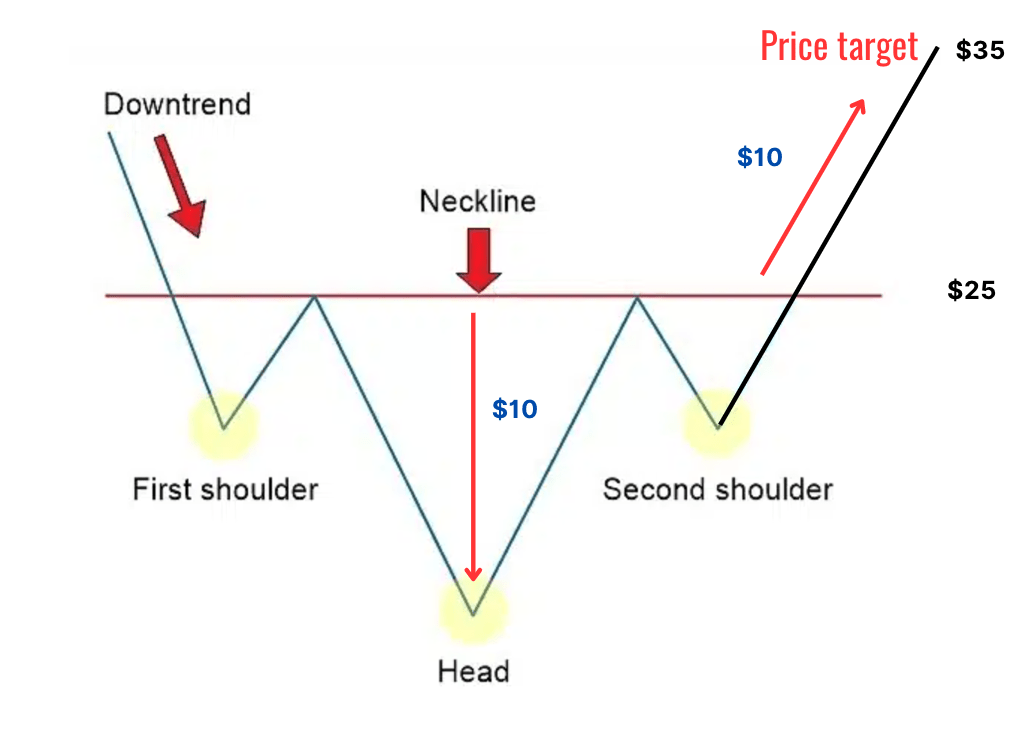
4. Head and Shoulders
The head and shoulders pattern is a classic bearish reversal pattern. It consists of a higher peak (head) between two lower peaks (shoulders). The neckline is the support level drawn by connecting the low points after the left shoulder and the head.
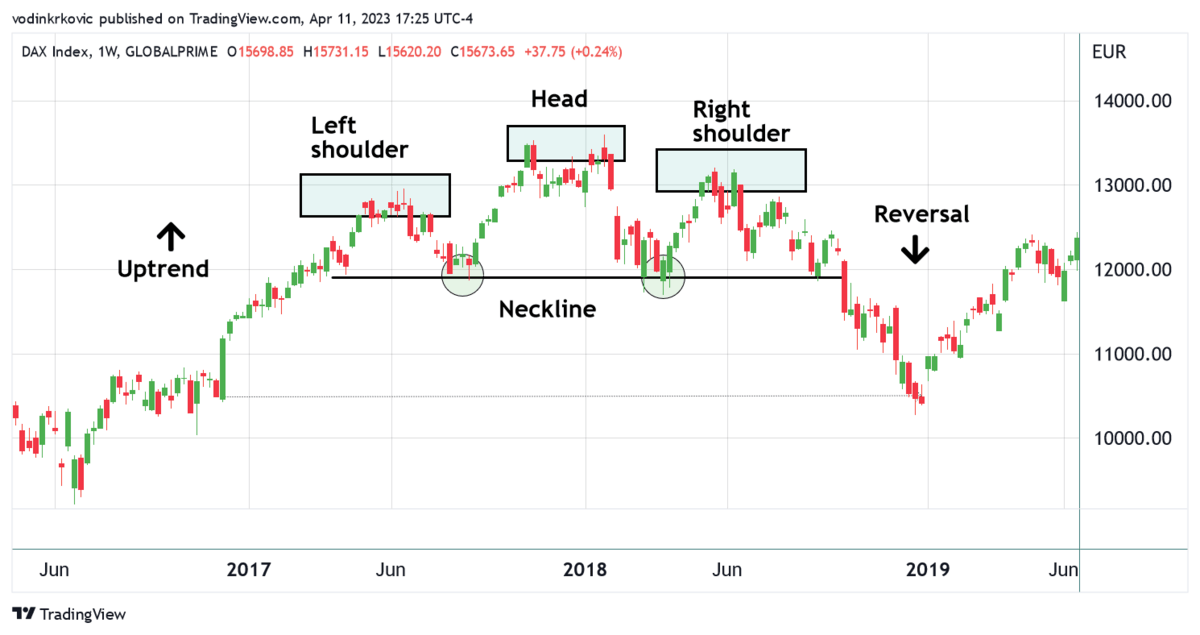
This is why the head and shoulders pattern is a strong bearish sign:
- The formation of the head and right shoulder suggests that buying pressure is waning — bulls are slowly losing control.
- The price reaches a similar high point twice (the left and right shoulders) and retraces both times, showing that the price can’t break through that resistance level.
- The pattern represents a change in market sentiment, with market participants starting to question the uptrend’s sustainability — as a result, the bears may become confident and push the price down.
- The breakdown below the neckline on increased volume provides a clear sell signal.
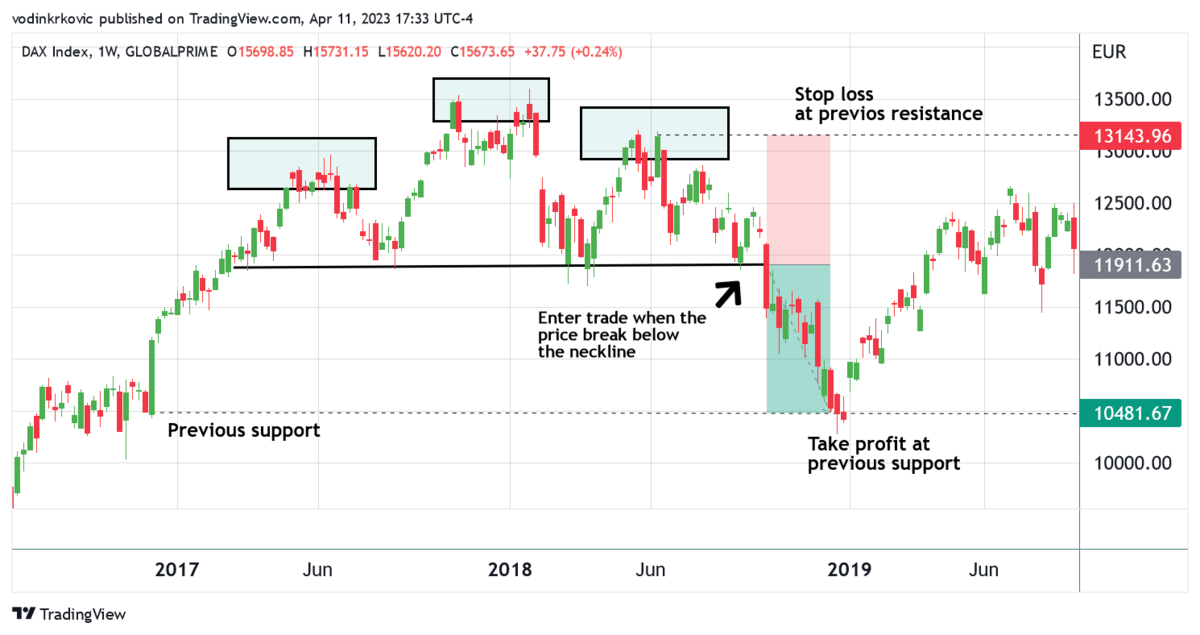
How to Trade the Head and Shoulders Pattern:
Here’s how many traders approach the head and shoulders pattern:
- First, identify the pattern on a chart as it is forming.
- If the pattern is forming at the end of an uptrend, it indicates that a reversal is likely.
- Wait for a breakdown below the neckline, ideally on increased volume.
- Once the breakdown is confirmed, enter a short position. Either enter immediately after the breakdown or wait for a potential retest of the broken neckline.
- Place a stop-loss order above the right shoulder or the most recent swing high within the pattern.
- Set the take-profit order at a previous key support level and wait for the trade to play out.
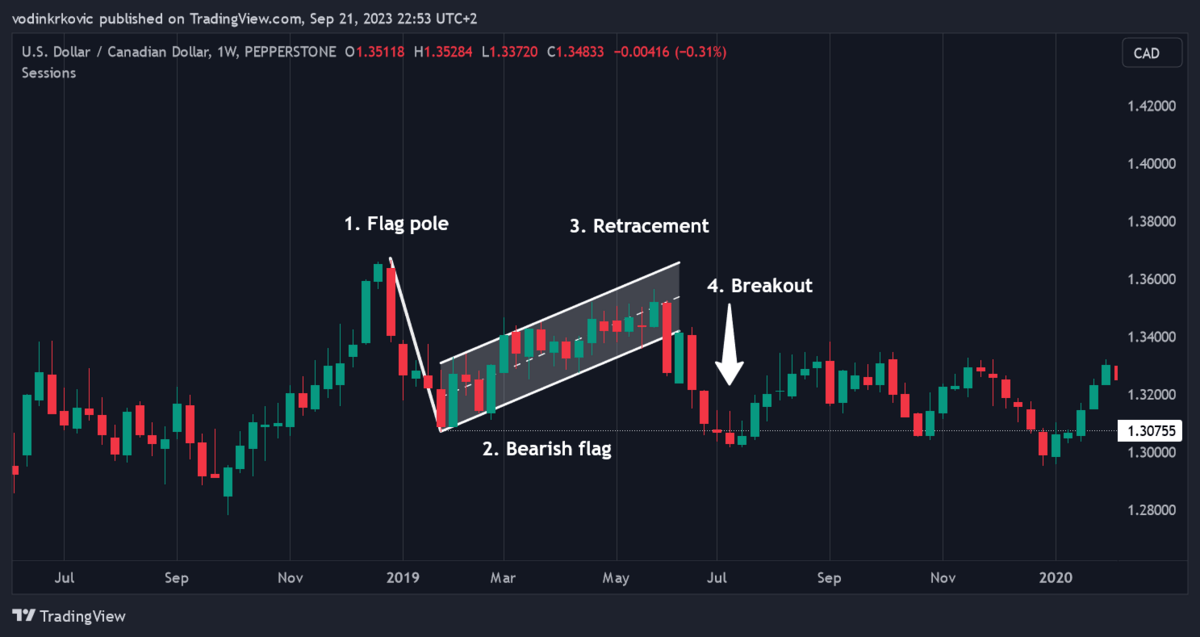
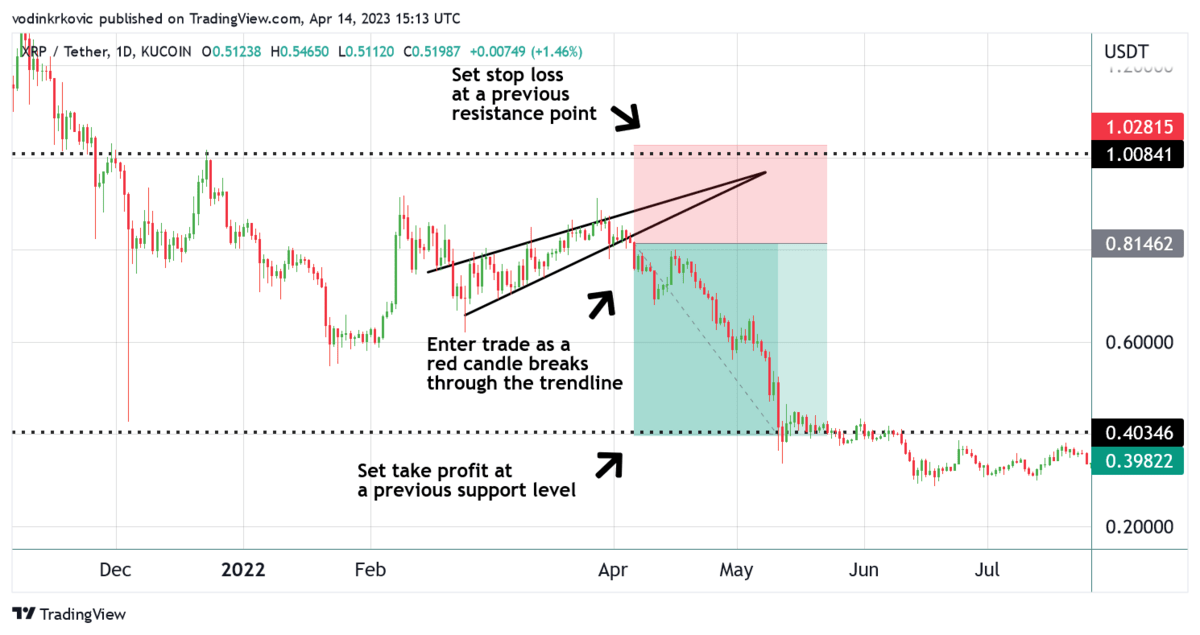
5. Rising Wedge
The rising wedge is a bearish reversal pattern that typically forms during an uptrend.
It is made out of converging trendlines that slope upwards, with the lower trendline being steeper than the upper one.
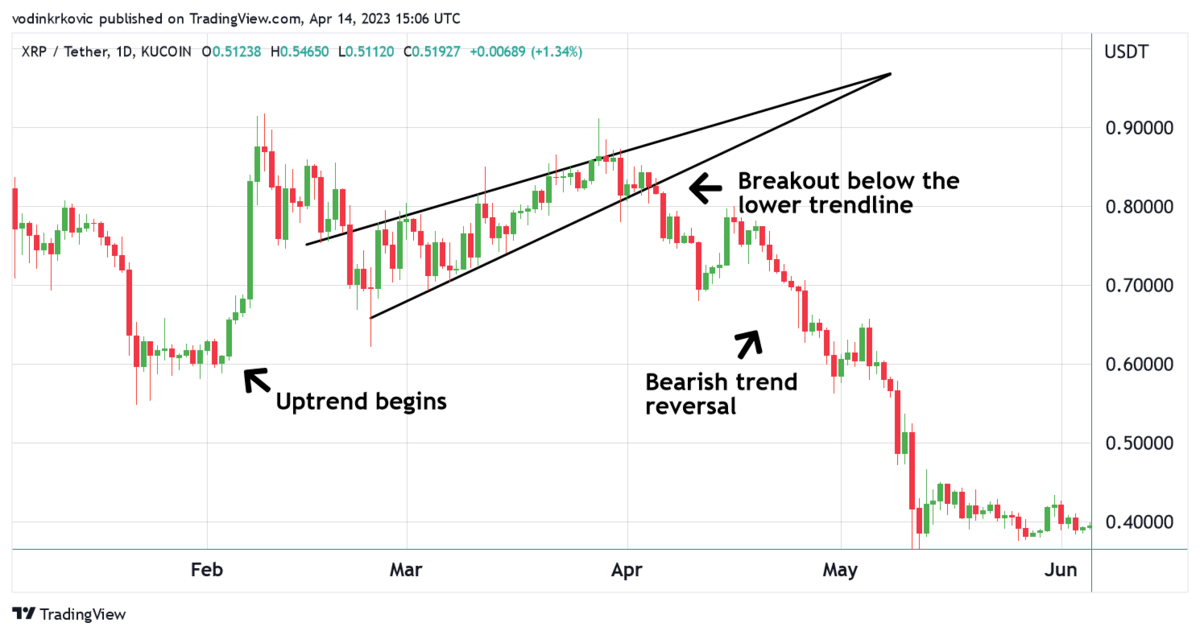
Here are the key reasons why the rising wedge is considered a strong bearish signal:
- The rising wedge pattern demonstrates that the uptrend is losing momentum, as the price action contracts within the narrowing range. Buying pressure is weakening, and the bears are taking control.
- The upward price movement within the rising wedge can give traders a false sense of security, as it may appear as though the uptrend is still intact.
- A breakdown below the lower trendline of the rising wedge, ideally on increased volume, confirms the bearish reversal. This signals that the bears have taken control.
How to Trade the Rising Wedge Pattern:
Here’s how many traders approach the rising wedge pattern:
- Look for a chart pattern with converging trendlines that slope upwards, with the lower trendline being steeper than the upper one.
- Ensure that the Rising Wedge pattern is forming during an uptrend or near a resistance level.
- For entry, wait for a breakdown below the lower trendline, ideally on increased volume.
- Place a stop-loss order above the most recent swing high within the pattern or above the upper trendline of the wedge.
- Set the take-profit order at a previous support level.
6. Bearish Engulfing Candle
The bearish engulfing candle signals a potential trend reversal from bullish to bearish. But is a very weak signal, so it should only be used with other bearish signs.
It looks simple enough: a smaller bullish candle followed by a larger bearish candle that engulfs the body of the first candle.
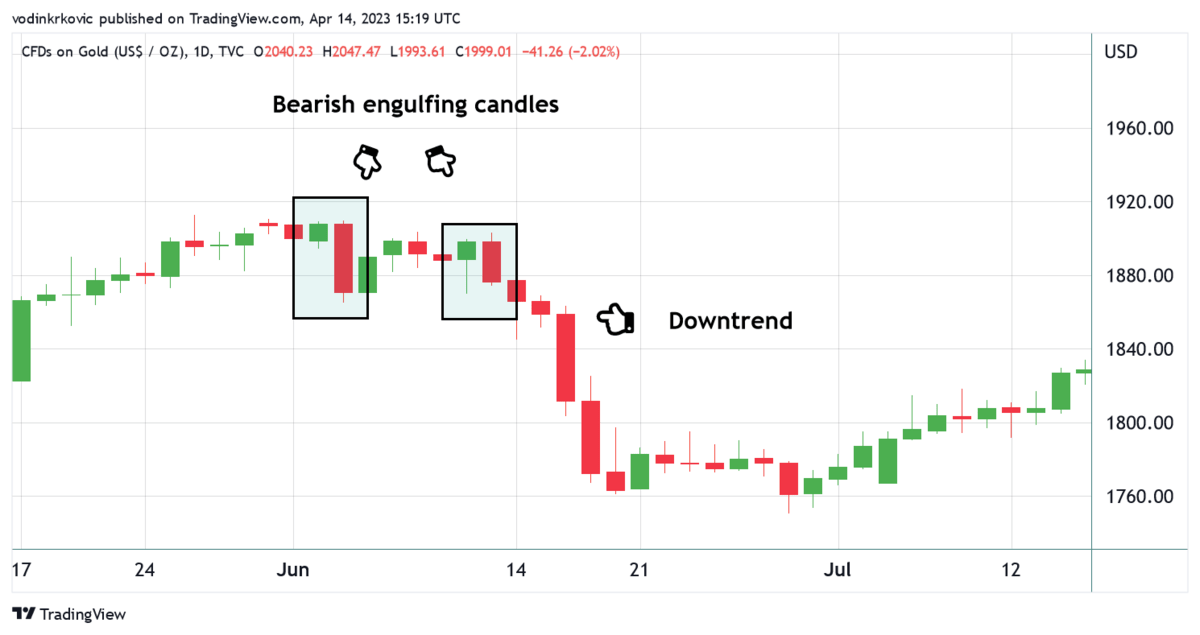
Here is what the bearish engulfing candlestick pattern represents:
- Shift in market sentiment: The second candle in the pattern (the bearish one) engulfs the body of the first candle (the bullish one) and shows that selling pressure has increased significantly.
- Rejection of higher prices: The fact that the bullish candle is followed by a bearish candle that engulfs it suggests that the market has rejected higher prices.
- Location matters: The bearish engulfing pattern is significant when it appears at the end of an uptrend or near a resistance level. In this context, it serves as a strong reversal signal.
- Confirmation: If the pattern is followed by additional bearish candles or other bearish signals, it further confirms the potential for a trend reversal.
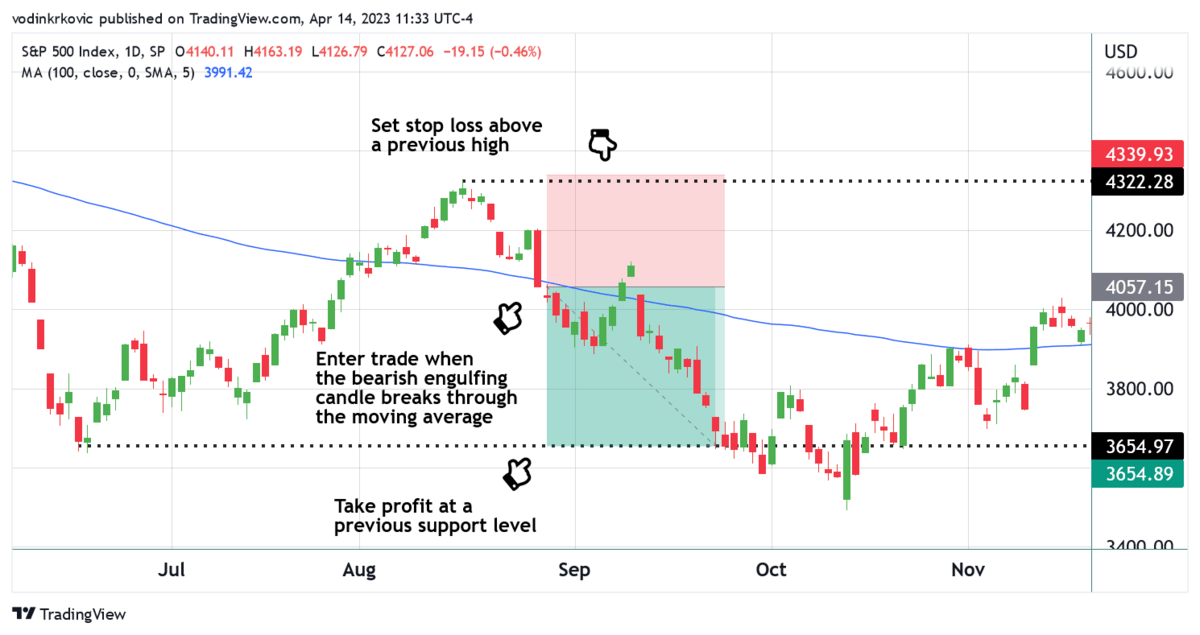
How to Trade the Bearish Engulfing Candle:
Here’s how many traders approach the bearish engulfing candle pattern:
- Look for a two-candle pattern with a smaller bullish candle followed by a larger bearish candle. This pattern should ideally appear at the end of an uptrend or near a resistance level.
- The bearish candle isn’t reliable on its own; it’s best used with other indications of a bear swing. For example, if the candle breaks through a relevant moving average and the market is trending down longer-term, consider entering the trade.
- Wait for confirmation — this could be another bearish candle following the bearish engulfing pattern or other technical indicators signaling bearish momentum.
- Enter the trade: Once there’s confirmation, it may be time to enter a short position with a price target at a previous support level.
- Place a stop-loss order above a nearby swing high or resistance level.
Enhance your day trading edge
Education
- Best overall day trading course: Investors Underground
Tools
- Best charting software: TradingView Pro+
- Best trading computer: Radical X14 Gladiator from EZ Trading Computers
- Real-time news: Benzinga Pro
Brokers
- Best for beginners: eToro*
- Best for advanced traders: TradeStation
eToro securities trading is offered by eToro USA Securities, Inc. (“the BD”), member of FINRA and SIPC. Cryptocurrency is offered by eToro USA LLC (“the MSB”) (NMLS: 1769299) and is not FDIC or SIPC insured. Investing involves risk, and content is provided for educational purposes only, does not imply a recommendation, and is not a guarantee of future performance. https://www.wallstreetzen.com is not an affiliate and may be compensated if you access certain products or services offered by the MSB and/or the BD.
Final Word: Day Trading Patterns
Day trading patterns are an invaluable tool that profitable day traders rely on.
However, they should never be used as the sole reason to get into a trade. They’re most effective when combined with other indicators and signals.
The big takeaway? It’s well worth the time to learn these common trade patterns. However, don’t ignore other signs the market sends you. If you don’t have multiple good entry signals in addition to a clear pattern, have the confidence to walk away and avoid losses!
FAQs:
Do Patterns Work in Day Trading?
Yes, but not all the time. Trading patterns only indicate that a certain outcome is probable — not guaranteed. Often, patterns are used in combination with technical indicators, market structure analysis, as well as stop-losses in case of an unexpected price swing.
Is Pattern Day Trading Illegal?
No, pattern day trading is not illegal. However, in the United States, the Financial Industry Regulatory Authority (FINRA) enforces the Pattern Day Trader (PDT) rule, requiring traders who execute 4+ trades in five business days using margin to maintain at least $25,000 on their trading balance.
Do Pattern Day Traders Make Money?
Very few day traders make money. A 2014 study titled "The Cross–Section of Speculator Skill Evidence from Day Trading" suggests that only 15% of traders consistently make profits greater than their trading commissions and other related costs.
What Type of Day Trading Is Most Profitable?
The profitability of any trading strategy depends entirely on the trader. However, some of the most profitable traders use tried-and-tested strategies like momentum trading, breakout trading, scalping, and range trading.
Where to Invest $1,000 Right Now?
Did you know that stocks rated as "Buy" by the Top Analysts in WallStreetZen's database beat the S&P500 by 98.4% last year?
Our June report reveals the 3 "Strong Buy" stocks that market-beating analysts predict will outperform over the next year.