Jessie Moore has been writing professionally for nearly two decades; for the past seven years, she's focused on writing, ghostwriting, and editing in the finance space. She is a Today Show and Publisher's Weekly-featured author who has written or ghostwritten 10+ books on a wide variety of topics, ranging from day trading to unicorns to plant care.
Retail trading has exploded in recent years. While many traders have profited handsomely, many others have not.
Can technical analysis in trading help ensure you’re one of the profitable few?
Does technical analysis work?
The short answer to both is yes — it can be, if you have the right mindset and use it properly.
In this article, I’ll explain everything you need to know about trading with technical analysis — what it is, how it’s used, and how you can use technical analysis in trading to improve your chances of success.
Smart traders consider a variety of factors before executing. A combination of technical analysis plus real-time news alerts can help strengthen your conviction in trades.
Our pick for real-time news? Benzinga Pro. It’s a great pick for active day traders who need real-time quotes, news, and scanners and traders who want to know about potential trend changes. You can get a 2 week FREE trial of Benzinga Pro using this link.
What is Technical Analysis?
Technical analysis in trading is a method of analyzing stock price movements in an attempt to discern signals and identifiable stock market patterns to predict future trends.
At its simplest, think of it this way:
Over time, traders notice that when a stock does X, it is likely to do Y.
It’s an accumulation of historical precedents that says, “Most of the time when this price action occurs with this volume, for example, we expect the subsequent price trend to be as follows.”
Technical analysts are typically concerned with the following:
- Trends: Or directional patterns on a chart from which traders can infer future price movements based on historical activity. If a trader believes a stock will continue trending up, this might prompt a signal to buy.
- Momentum: Refers to the rate of change of a particular stock price. For example, a price that moves from $5 to $10 in one week has more momentum than a price that moves from $5 to $10 over one year. This is another signal a trader might account for when making trade decisions.
- Moving averages: An average of a stock’s price movements in the past and help smooth out price fluctuations. They can help traders answer the question: is today’s price movement part of a broader trend or a short-term distortion?
- Support levels: Prices a technical analyst expects a stock will not fall below. As a stock price drops and approaches the support level, a trader can buy the stock, anticipating it will reverse course and begin appreciating in value. Essentially, support levels are prior lows.
- Resistance levels: The price a technical analyst does not expect the stock to surpass. On a chart, these bands can provide an exit point for a particular trade (i.e., sell the shares before the inevitable reversal and decline). Resistance levels are the inverse of support levels.
- Indicators: Metrics that assess current conditions and future potential trends. They act as signals. They help inform traders of supply and demand.
The accumulation / distribution (A/D) line, for example, is used to assess the flow of money in and out of a security—the closer shares close to their high, the more weighting volume recipes in an A/D line. These powerful signals can help enhance your technical analysis trading.
As a tool, technical analysis can help traders predict future price movements. It assumes that historical price action can more accurately inform the future.
Over time, the discipline has established hundreds of identifiable patterns.
Typically, technical analysis is used by traders looking to predict short, rather than long-term price movements.
Technical Analysis vs. Fundamental Analysis
Typically, traders will speak of two main types of analysis: technical and fundamental.
Fundamental Analysis
While technical analysis is concerned with historical price action and volatility, among other factors, fundamental analysis is concerned with a company’s financial statements.
When you hear “health of a company,” for example, it’s likely a reference to the business’s underlying “fundamentals.”
Fundamental analysts are typically after what they perceive as undervalued companies. Companies whose stock price does not reflect its underlying accounting health (i.e., the stock price is low relative to the company’s earnings, for example).
Technical Analysis
Technical analysts, on the other hand, don’t necessarily care about fundamentals. Trading with technical analysis focuses on price movements, not whether that movement was justified.
A technical analyst would have no problem purchasing shares in an overvalued company (according to a fundamental analyst), provided they expect the share price to rise.
Nothing says you can’t combine both approaches. However, the methods may lead you to opposing trade decisions in some cases. Other times, the techniques may align, helping build even more conviction in a trade decision than using one or the other in isolation.
Does Technical Analysis Work?
Yes. Technical analysis in trading has been shown to help improve trade decisions and profitability.
For example, the Head and Shoulders charting pattern has been found to offer correct directional predictive powers nearly 9 out of 10 times.
Using technical analysis in trading can help improve your odds, increasing the relative number of successful trades you complete.
But it’s not perfect. There will always be factors in the market that you can’t control. So trading with technical analysis is neither perfect nor black and white.
Technical analysis can help improve your conviction in trades. But it’s not a magic bullet. It provides traders with increased predictive power, not guaranteed predictions.
Pros and Cons of Technical Analysis
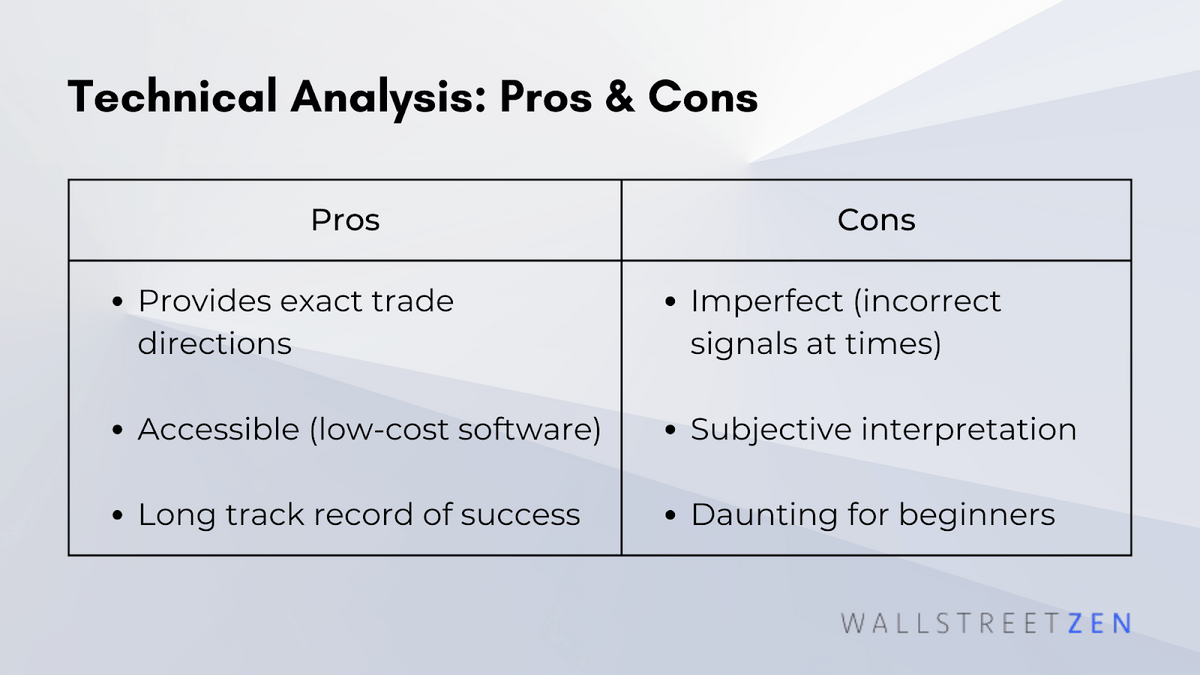
Pros:
- It can provide clear trade directions, including entry and exit prices, whereas fundamental analysis requires more discretion in investment decision-making.
- Technical analysis has become increasingly accessible even to part-time traders as charting software and tools have rapidly lowered in price.
- Technical analysis for trading has been used for well over 100 years, with some patterns possessing a nearly 90% prediction success rate.
Cons:
- It can provide mixed signals at times. Even the head and shoulders pattern formation will be wrong roughly 10% of the time.
- Despite using hard numbers, technical analysis is still ultimately a subjective approach. One trader may see a pattern forming, whereas another may not. One trader may have conviction in a trade signal, whereas another may not.
- For some traders, the sheer number of patterns available can be overwhelming.
Example of Trading with Technical Analysis
While technical analysis uses various indicators and metrics, let’s look at a relatively simple example.
Imagine you’re a trader analyzing the price trend of a stock. You decide to plot three different lines as part of your analysis:
- Daily stock price.
- Stock price’s 50-day moving average (i.e., each point on the chart represents that average price over the preceding 50 days).
- Stock price’s 200-day moving average (i.e., each point on the chart represents that average price over the preceding 200 days).
You believe that when the 50-day moving average line crosses above the longer-term 200-day moving average line, it signals an upward price trend and a buy signal.
You also believe that when the 50-day moving average line crosses below the longer-term 200-day moving average line; it signals a downward price trend and, therefore, a sell signal.
As a reminder, the 50 and 200-day moving averages eliminate the very short-term fluctuations that can occur daily. The rationale is; shorter time frames are more susceptible to noise and are less effective at delivering a meaningful signal.
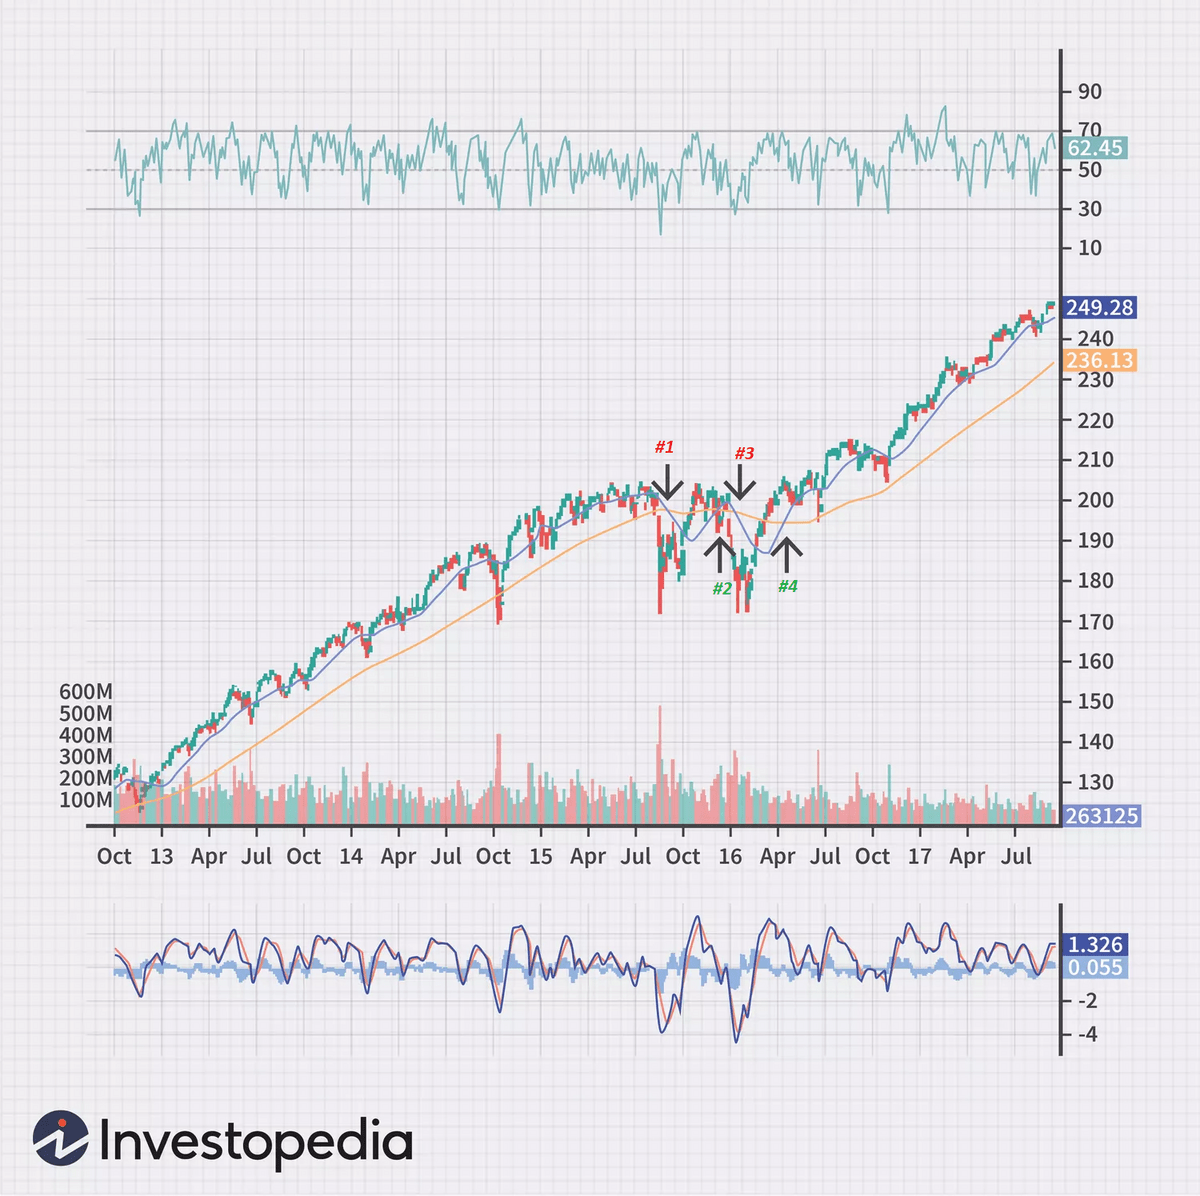
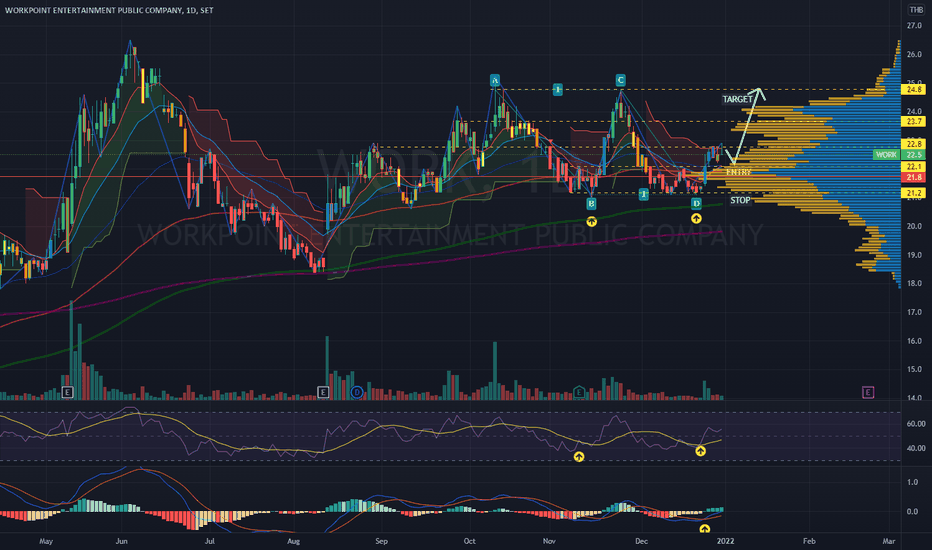
Looking at the four arrows above, we can infer the following:
- Arrow #1: The 50-day moving average crosses below the 200-day moving average, and the stock’s price experiences a subsequent small drop in price.
- Arrow #2: 50-day moving average crosses above the 200-day moving average, and the stock’s price experiences a subsequent slight rise in price.
- Arrow #3: The 50-day moving average crosses below the 200-day moving average, and the stock’s price experiences a subsequent drop.
- Arrow #4: The 50-day moving average crosses above the 200-day moving average, and the stock’s price experiences a subsequent substantial rise in price.
Technical analysis works best with a strong foundation of knowledge — and the right tools. Here are some ways to maximize technical analysis:
Technical analysis tools
- Best charting software: TradingView Pro+
- Best trading computer: Radical X13 EZ Trading Computer
Technical analysis education
- Best day trading course: Investors Underground
- Best investing courses for beginners: Udemy
- Best way to practice: eToro Demo Account*
eToro is a multi-asset investment platform. The value of your investments may go up or down. Your capital is at risk.
Is Technical Analysis All You Need to Become a Profitable Trader?
Many successful traders rely mainly on technical analysis to become profitable. However, relying too much on one methodology can be dangerous.
A more prudent approach is to be open to utilizing any valuable tools, including fundamental analysis.
At times, the fundamental analysis signals may contradict the technical analysis signals. A trader may lower their conviction in a trade decision in these instances.
A trader may also leverage multiple technical analysis tools. An extensive library of tools is at your disposal, made all the more accessible by increasingly lower-cost trading software.

Smart traders consider a variety of factors before executing. A combination of technical analysis plus real-time news alerts can help strengthen your conviction in trades.
Our pick for real-time news? Benzinga Pro. It’s a great pick for active day traders who need real-time quotes, news, and scanners and swing traders who want to know about potential trend changes. You can get a 2 week FREE trial of Benzinga Pro using the link below.
How to Develop Your Technical Analysis for Trading
Nothing beats experience. When it comes to developing your technical analysis expertise, very little can replace hours behind the screen.
Apply what you learn in articles and courses and attempt to replicate the knowledge. Consider using practice accounts to test theories—experiment with different strategies at different times, in various sectors, etc.
Gather reps and gain wisdom.

Our favorite trading simulator?
eToro offers Demo Accounts where you can practice investing with $100,000 in virtual funds. You can buy stocks, ETFs, and cryptocurrencies, and test various buy-and-hold or technical trading strategies.
It’s a great way to test new strategies without putting your hard-earned cash on the line.
eToro is a multi-asset investment platform. The value of your investments may go up or down. Your capital is at risk.
Looking for more? Check out our article on the best stock market simulators.
Final Word: Does Technical Analysis Work?
Technical analysis’ long track record and continued popularity likely answer this question, but in case I wasn’t abundantly clear, yes, technical analysis works.
Any trading framework used irresponsibly can produce losses, and technical analysis is no different. That said, armed with an understanding of its powers and limitations, this discipline can deliver an edge to your track record, improving your odds of making successful trade decisions.
FAQs:
Do successful traders use technical analysis?
Yes, successful traders have been using technical analysis for over one hundred years. In fact, many traders use technical analysis as their primary trading strategy.
Does technical analysis work in investing?
Yes, technical analysis works in trading. Even large and successful fund managers will trade portfolios using technical analysis.
Does technical analysis work with trading crypto?
Yes, technical analysis works with trading crypto the same way it works with trading stocks. Stocks, however, have enjoyed a much larger track record using the system. Still, the same principles and patterns apply.
How profitable is technical analysis?
There is virtually no limit to the profit potential of technical analysis. Profitability within the discipline largely depends on the trader's expertise, adherence to tried and tested strategies, and the amount of risk undertaken and capital employed by the trader.
Where to Invest $1,000 Right Now?
Did you know that stocks rated as "Buy" by the Top Analysts in WallStreetZen's database beat the S&P500 by 98.4% last year?
Our July report reveals the 3 "Strong Buy" stocks that market-beating analysts predict will outperform over the next year.