Nate is a serial entrepreneur, part-time investor, and founder of WallStreetZen. He holds a Juris Doctor (JD) degree from UAlberta Law - but don’t hold that against him. He’s passionate about building great software that delights users. He occasionally writes about himself in the 3rd person.
The price-to-earnings ratio (P/E ratio) is a quick way to gauge whether a stock is undervalued or overvalued.
All else equal, the lower the P/E ratio, the better the investment. For this reason, a P/E of less than 20x is “good” and anything higher than 30x is “bad.”
But the P/E ratio can be misleading. A low P/E doesn’t necessarily indicate a good investment. In fact, in many cases it may mean the exact opposite.
Similarly, a stock with a high P/E isn’t necessarily an investment that should be avoided.
In order to be effective, the P/E ratio should be used as a benchmark and only used to determine a stock’s value in the context of its current and future growth.
If you want to use the P/E ratio to judge a stock’s value, you need to know the right way to use it. Keep reading to learn more about the nuance involved in making sense of P/E ratio, including examples like Tesla (NASDAQ: TSLA) and more.
WallStreetZen makes it easy to find, analyze, and compare a company’s P/E ratio. Plus, you can make benchmark and peer comparisons.
Unlike competitors, WSZ allows you to check the average P/E ratio when researching a specific company, so you have some context beyond just the ratio related to the company at hand.
You also get a detailed suite of due diligence checks in areas like valuation, performance, and dividends. So whether you’re checking out a proven company like Microsoft (NASDAQ: MSFT), a penny stock like Nine Energy (NYSE: NINE) , or a former meme stock mover like Koss (NASDAQ: KOSS), you get plenty of information to help you decide whether or not your logic is sound when considering an investment.
Conviction is key when investing. WSZ’s tools help you build stronger conviction before you put your money on the line.
Keep reading to see exactly how we do it, and use this link to unlock a 14-day trial of Premium for just $1:
How to Calculate the P/E Ratio
The P/E ratio is one of the most common metrics to judge a stock’s valuation.
But what does it actually mean? Not only should you know what is a good P/E ratio for a stock, you should know what makes it good (it’s more nuanced than you think, I’ll explain why below).
Here’s the formula for calculating the P/E ratio:
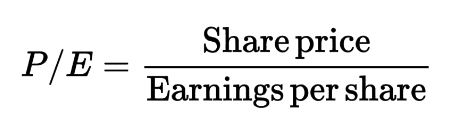
The ratio tells you how much you are paying per dollar the company earns.
If a stock trading for $30 per share had $2 in earnings, the P/E ratio would be 15x. Investors are paying $15 for every dollar of company earnings.
All else equal, the less you’re paying per dollar of earnings the better. However, not all earnings are equal.
$1 of earnings in a growing business with a strong, defensible moat is worth a lot more than $1 of earnings from a company facing brutal competition in a shrinking market.
That’s why relative valuation metrics like the P/E ratio are a good reference point, but cannot (alone) tell you whether a stock is a good investment.
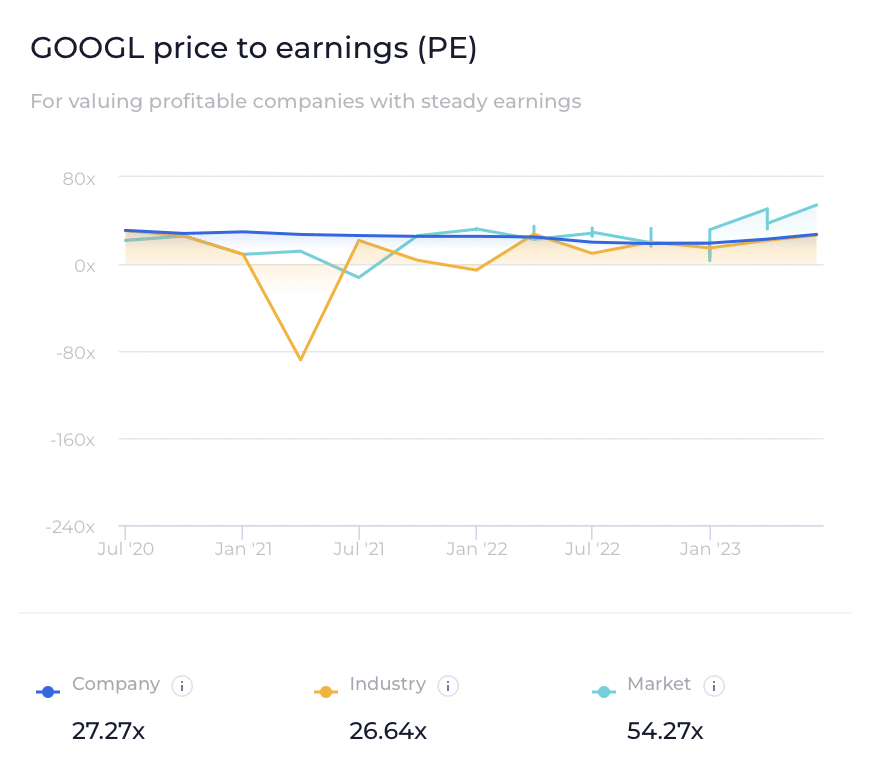
That’s where WallStreetZen’s approach to P/E ratio comes in. As you can see in the below image for Google (NASDAQ: GOOGL), you are able to check out not only the company’s P/E ratio, but the industry standard and overall market.
But it doesn’t stop there. On every stock’s detailed fundamental analysis page on the platform, you have access to all sorts of other key metrics on a given stock, including due diligence checks on criteria like valuation, financials, forecast, performance, and dividends that can help buoy your conviction before you invest.
When investing, every little bit of information and context can help you make more informed decisions when attempting to figure out if a stock has a good or bad P/E ratio.
What does the P/E Ratio Tell You?
Remember, the P/E ratio tells you how much you are paying for a stock per dollar of earnings generated.
Because of this, the metric allows you to easily compare 2 stocks with different prices.
For example, if stock ABC is worth $50 per share and stock XYZ is worth $10, which one is cheaper? Without more information, it’s impossible to say.
But what if I told you ABC generated $20 per share of earnings and XYZ generated $1? Now we can start to compare the 2 stocks.
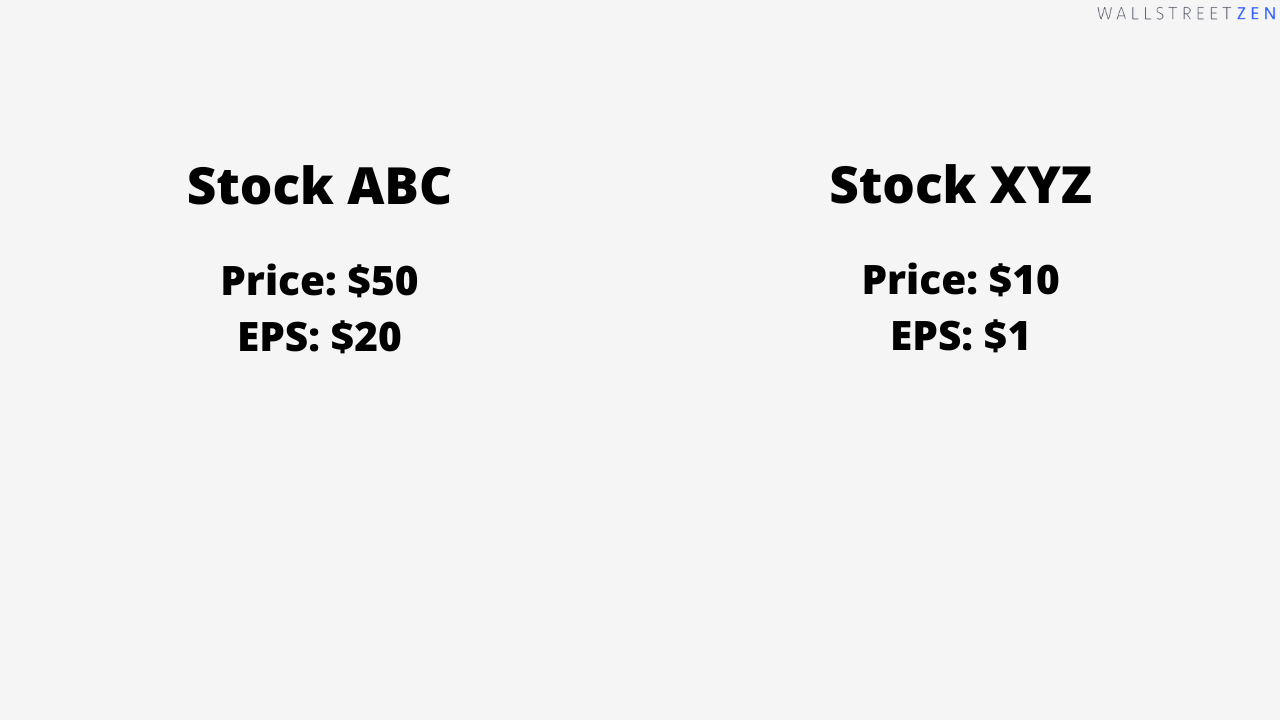
Using the P/E ratio, we know ABC is trading at a multiple of 2.5x, and XYZ is trading at a multiple of 10x. At this point, ABC looks like the better value.
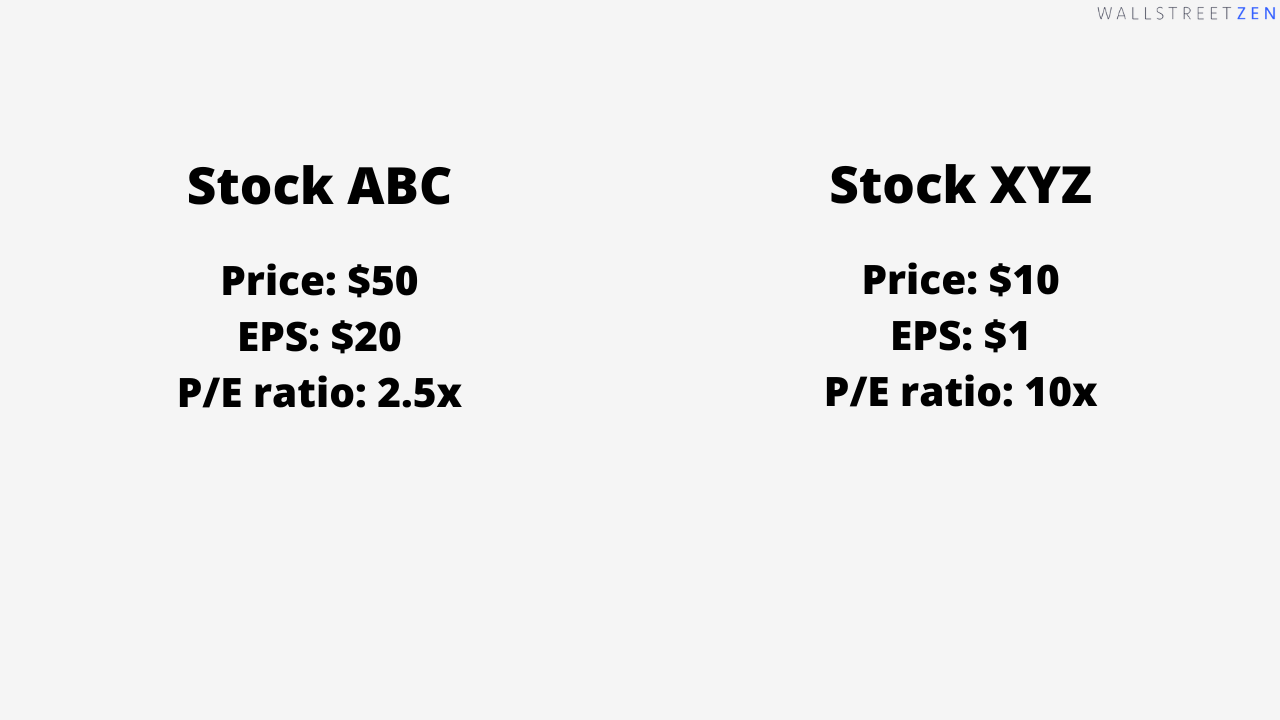
But we still need more information. It’s a start, but there is much more nuance to valuing stocks than using a simple metric like the P/E ratio.
If stock ABC is a utility company that provides 3G components and has no plans to innovate, its growth potential is severely limited. And if stock XYZ is a fintech stock that is growing 100% per year, a P/E of 10x is extremely cheap.
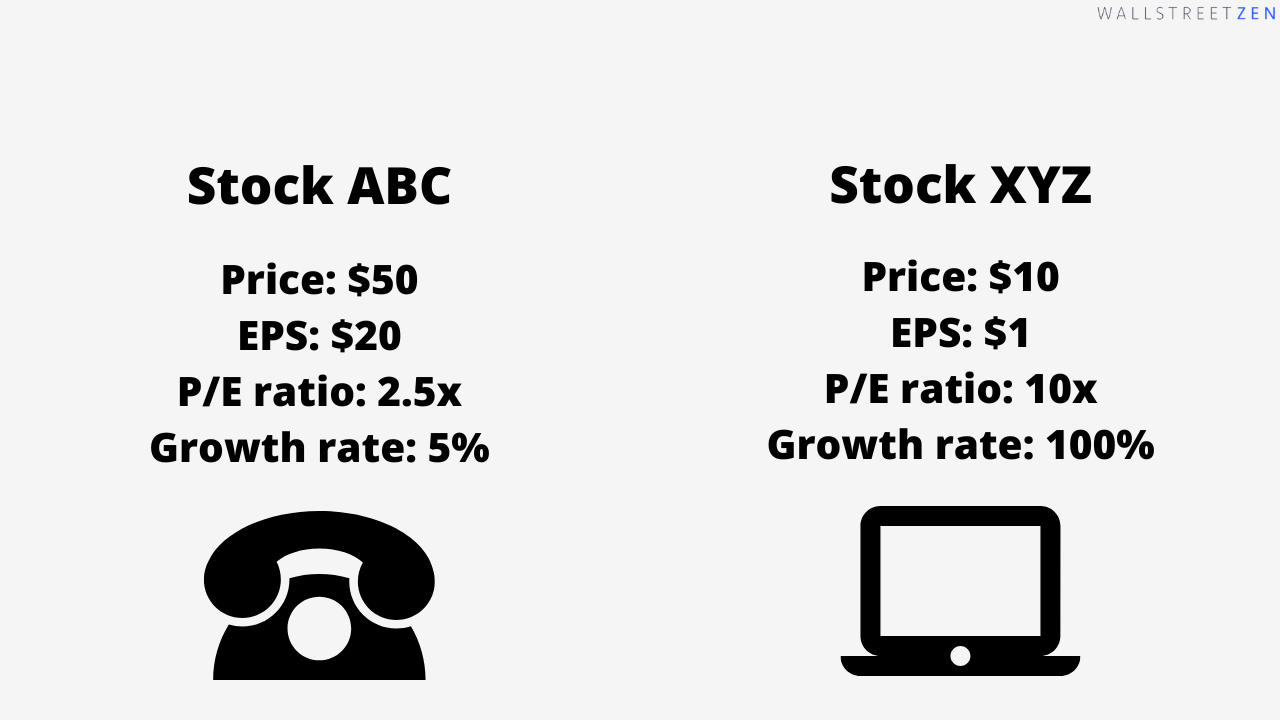
With this context, ABC should probably be avoided (despite its lower P/E) and XYZ should probably be bought (despite its higher P/E).
WallStreetZen makes it easy to find, analyze, and compare a company’s P/E ratio against its benchmarks and peers.
Keep reading to see exactly how we do it, and use this link to unlock a 14-day trial of Premium for just $1:
What is a Good P/E Ratio?
The short answer: The lower the P/E ratio, the better.
The long answer: It depends.
What is a Bad P/E Ratio?
The short answer: The higher the P/E ratio, the worse.
The long answer: It depends.
As mentioned above, you need a lot of context to determine if any stock’s P/E ratio is good or bad – it’s heavily dependent upon the strength of the company’s earnings, its peers’ earnings, and more.
That’s why we have several reference points for each stock’s P/E, including peer and market comparisons and due diligence checks:
Each of these checks adds significant color to a stock’s earnings multiple and helps you determine whether it’s a good or bad P/E ratio.
Drawbacks of the P/E Ratio
As you can tell by now, the P/E ratio is almost useless without additional context. This is the major drawback of using the P/E ratio.
Because of this, there’s no hard-and-fast rule for what is a good pe ratio. But the P/E ratio is not worthless – you just need to learn how to use it correctly.
This metric should be used in a comparative capacity, relative to its peers, the market as a whole, its own historical trading, and its growth and (most importantly) projected growth.
How to Use the P/E Ratio
Whenever you see a P/E ratio, the first question you should ask is: “Why? Why is this stock trading at this valuation? Why is this stock trading at this price?”
Let me explain by way of example:
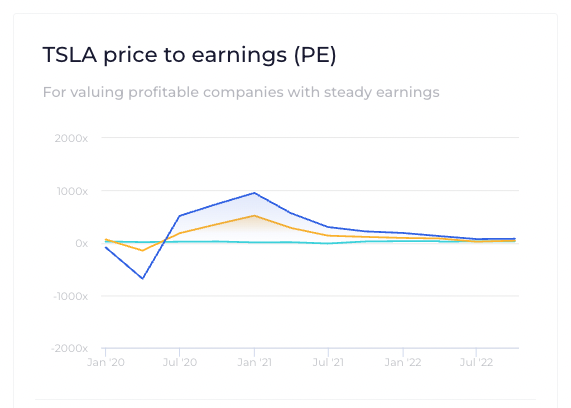
If TSLA is trading for 78x earnings, that doesn’t necessarily mean it’s a poor value:
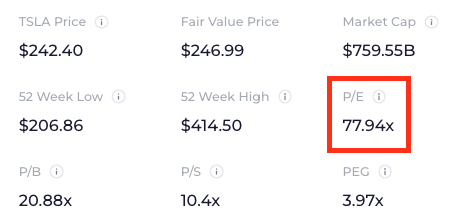
Sure, $78 for every $1 of earnings seems like a high price, but millions of investors are paying that price. You’re not the only one using the P/E ratio.
So you have to ask yourself, “Why are people paying 78x earnings for Tesla?”
The P/E Ratio and Investors’ Expectations
Let’s go back to my example from before.
If stock ABC, the utility company, is trading for $50 per share and has $20 in earnings, it is trading at a P/E of 2.5x. By now, you know to ask the magic question: Why is it trading so low?
By looking a little closer, you see that the company is projected to grow at -20% per year. Next year’s earnings will be $16 and the following year will be $12.80.
At that point, if ABC is still trading at a P/E of 2.5x, the share price will be worth $32, a 36% decrease.
Conversely, consider XYZ, the fintech company, which is trading for $10 per share on $1 in earnings. It’s projected to grow at 100% per year for the next 3 years, meaning next year’s earnings will be $2, then $4 the year after.
At that point, if XYZ is still trading at a P/E multiple of 10x, the share price will be worth $40, a 300% gain.
As an investor, which stock is the more attractive purchase?
Stock XYZ.
How much are you willing to pay for a stock that is increasing by 100% per year? A lot, and so will other investors, which will raise its P/E multiple.
How much are you willing to pay for a stock that is decreasing by 20% per year? Not much (neither will anyone else), which is why its P/E will be low.
The P/E ratio primarily reflects investors’ expectations about the future performance of a stock.
In the case of TSLA, a P/E ratio of 78x tells us investors are anticipating a lot of growth in the future and they are willing to pay a premium to own its shares today.
Benchmarks
Now that we know the P/E ratio is a reflection of investors’ expectations, it’s time to start applying it.
It’s not entirely fair to compare an utility company with a fintech company – they operate in entirely different industries with different growth opportunities. But since many stocks in the same industry have very similar growth opportunities, it’s useful to compare their valuations to gauge relative valuations.
For instance, here’s how TSLA’s P/E ratio compares to its peers:
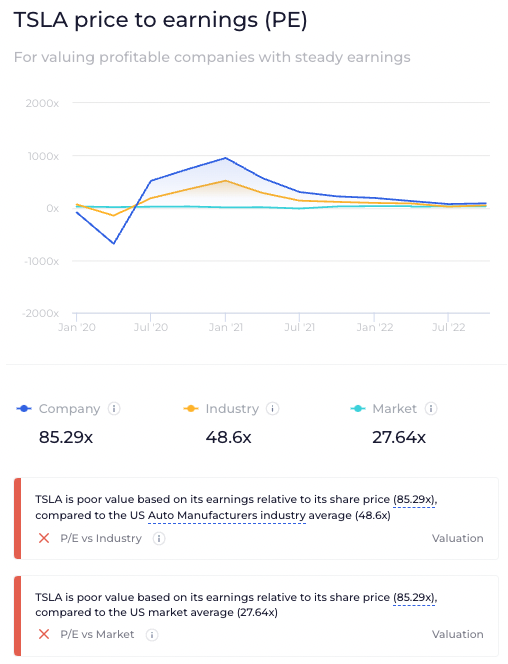
Knowing what we know now, we should expect Tesla’s earnings growth to be above its competitors:

And since investors are always looking into the future, we should see something similar for Tesla’s forecasted earnings growth:
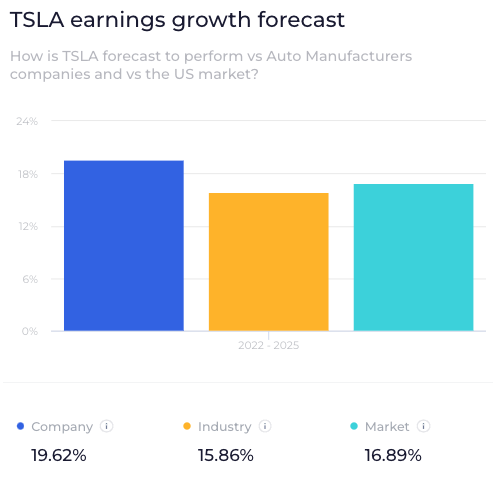
You can also see Tesla’s P/E and earnings growth rates compared to the U.S. stock market in general. This is another useful barometer for valuing a stock relative to others.
The Bottom Line: The P/E Ratio on WallStreetZen
The P/E ratio has its limitations, but when used correctly it can be a powerful tool to gauge a company’s valuation relative to its peers, its market, and its historical range.
Unfortunately, valuing a stock is incredibly nuanced. There is no single financial ratio you can use to make buy/sell/hold decisions.
But, if you like fundamental analysis and the challenge of uncovering undervalued stocks, it’s also what makes investing challenging and fun.
We built WallStreetZen with you in mind.
You may not have a finance degree or decades of Wall Street experience, but that doesn’t mean you can’t make great investing decisions based on proper fundamental analysis and due diligence.
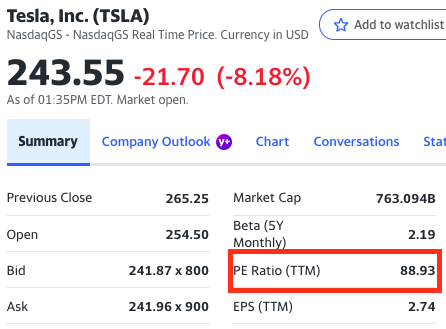
And when other websites report a P/E ratio on its own (like Yahoo Finance), we know a P/E ratio is actually a reflection of millions of investors’ expectations. To make sense of any stock’s P/E, you need context.
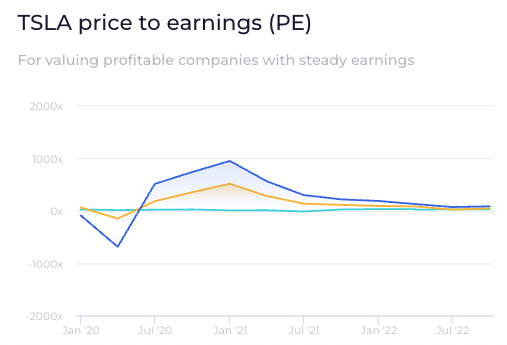
This is how Yahoo Finance displays TSLA’s P/E:
This is how WallStreetZen displays the P/E ratio:

See the difference?
Easily see how the stock’s P/E ratio has changed over the last 2 years, compare it to other auto manufacturers, and the U.S. market average.
And if you’ve learned anything about the P/E ratio from this article it’s that context matters.
So head to WallStreetZen and start interpreting the P/E ratios of your favorite stocks.
You can start by adding them to a free Watchlist.
Or, better yet, grab your 14-day trial now and unlock everything WallStreetZen Premium has to offer:
FAQs:
What is a good PE ratio to buy?
Any P/E ratio under 20 is generally considered undervalued.
That said, the answer to this question is incredibly nuanced. It depends on how stable the earnings are and how likely they are to grow in the future.
A stock's P/E ratio typically indicates the quality of a company and its earnings - the higher the P/E, the better the company and more likely it is to grow in the future. However, the higher the P/E, the less likely the stock is to be undervalued.
What is a strong PE ratio?
A strong PE ratio is one where a stock's expected growth rate should command a P/E ratio much higher than the stock is currently trading for.
Is a PE ratio of 5 good?
A PE ratio of 5 is both good and bad.
It's good because the stock is trading at a very cheap valuation, just 5x EPS. However, very low P/E ratios typically indicate a company with very little growth potential or possibly one that will decrease in size in the future.
Where to Invest $1,000 Right Now?
Did you know that stocks rated as "Buy" by the Top Analysts in WallStreetZen's database beat the S&P500 by 98.4% last year?
Our June report reveals the 3 "Strong Buy" stocks that market-beating analysts predict will outperform over the next year.