If you’ve looked for fundamental analysis tools before, you know that most financial websites and popular stock research tools don’t focus on the information that’s really important to fundamental investors.
Instead, you get a lot of earnings speculation, chart analysis, and pundits trying to forecast whether the market will be up or down.
While this is fine for other investors, for those of us trying to find companies at attractive prices relative to their quality, we’re not concerned about trying to guess short term price movements.
Instead, we’re seeking to understand the company’s actual business performance, which is what drives long-term stock performance.
And we want to understand whether the company is fairly valued. As Benjamin Graham once said:
“In the short run, the market is a voting machine but in the long run, it is a weighing machine.”
Benjamin Graham
In this guide, I’ve picked out what I think are the 4 best fundamental analysis tools on the web, including the lowdown on our own fundamental analysis tool, WallStreetZen (you can start your 14 day trial here).
These are tools that will quickly show you the health of a company’s balance sheet, whether a company can meet its debt payments, whether the company is fairly valued based on proven valuation models, and much more.
Here are the best fundamental analysis tools (aka fundamental analysis software and fundamental analysis websites) for fundamental investors and value investors:
For more ideas, consider checking out these Bloomberg Terminal alternatives.
1. WallStreetZen (Our Fundamental Analysis Tool)
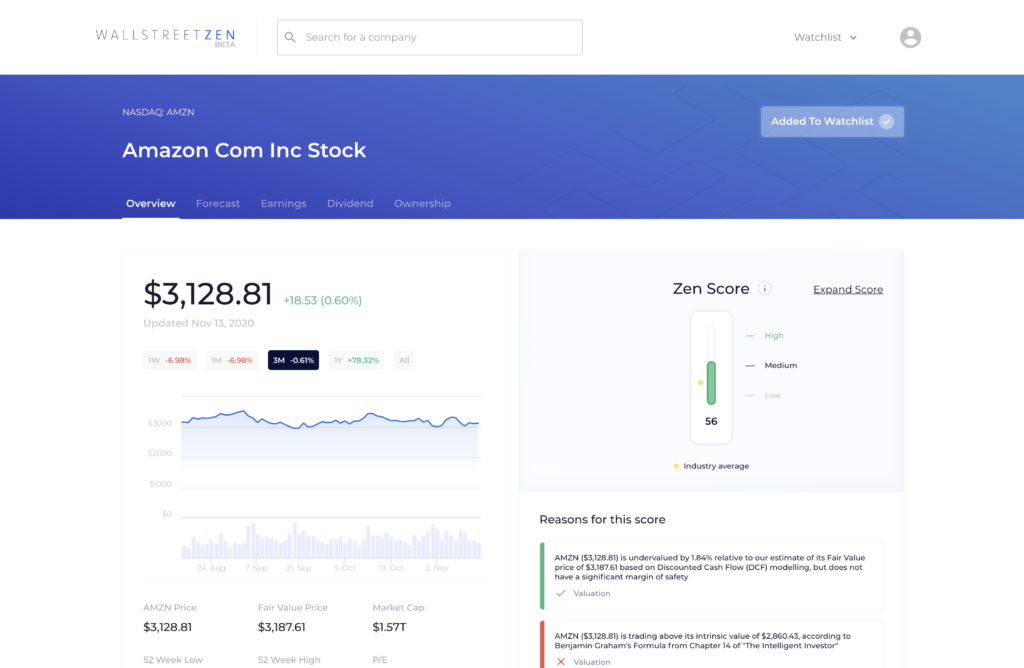
I created WallStreetZen with my tiny (but powerful 💪) team because I was frustrated with the stock analysis websites I was using.
They were cluttered with dense tables filled with numbers, but they didn’t really give me the context I needed to easily understand the company’s fundamentals.
While I care about earnings and price – as a fundamental investor, I wanted these sites to show me whether the company can make its debt payments.
I wanted them to show me if their profit margin was growing.
I wanted them to show me if the stock is undervalued based on a detailed discounted cash flow valuation.
I wanted to quickly see the company’s historical return on equity.
And more importantly, I wanted to quickly see how these numbers compare to the other companies in the industry.
So we set out to create a better stock analysis experience geared towards investors like me and you, who may not be financial professionals but want to deeply understand the fundamentals of the companies we invest in.
WallStreetZen’s Strengths
- Extremely easy to use – intuitive visualizations provide industry, market, and historical context for important metrics
- Zen Ratings – automated check make it easy to quickly get a sense of a company’s fundamental strengths and weaknesses
- Automated due diligence checks – saves research time and eliminates spreadsheets
- All-in-one tool
- Designed for part-time investors
- Affordably priced
We built WallStreetZen to make fundamental analysis accessible to those of us who want to find quality companies at fair prices, but don’t necessarily want to spend hours tweaking assumptions in discounted cash flow models or digging around in financial statements.
WallStreetZen balances powerful analysis with ease of use. It was designed specifically for part-time investors who are also serious about doing their due diligence before buying a stock online.
(Interested in learning about how to buy OTC stocks?)
The best way to highlight what makes WallStreetZen uniquely powerful is with a few examples, but if you’d prefer to just explore the tool yourself, you can head over to WallStreetZen and start your trial today.
Back to examples – let’s just start with the most popular financial ratio – price to earnings.
Price To Earnings
This is how Yahoo Finance displays the P/E ratio for Amazon (NASDAQ: AMZN):

How should the average investor interpret this?
- Is the current P/E ratio of 96.82 high or low relative to other online retailers?
- Is it high or low compared to the market average?
- Is it high or low compared to 2 years ago?
The number 96.82 just doesn’t paint the full picture.
Yes, you could figure this out if you did more digging – but personally, I just want to see this all-important context displayed up front.
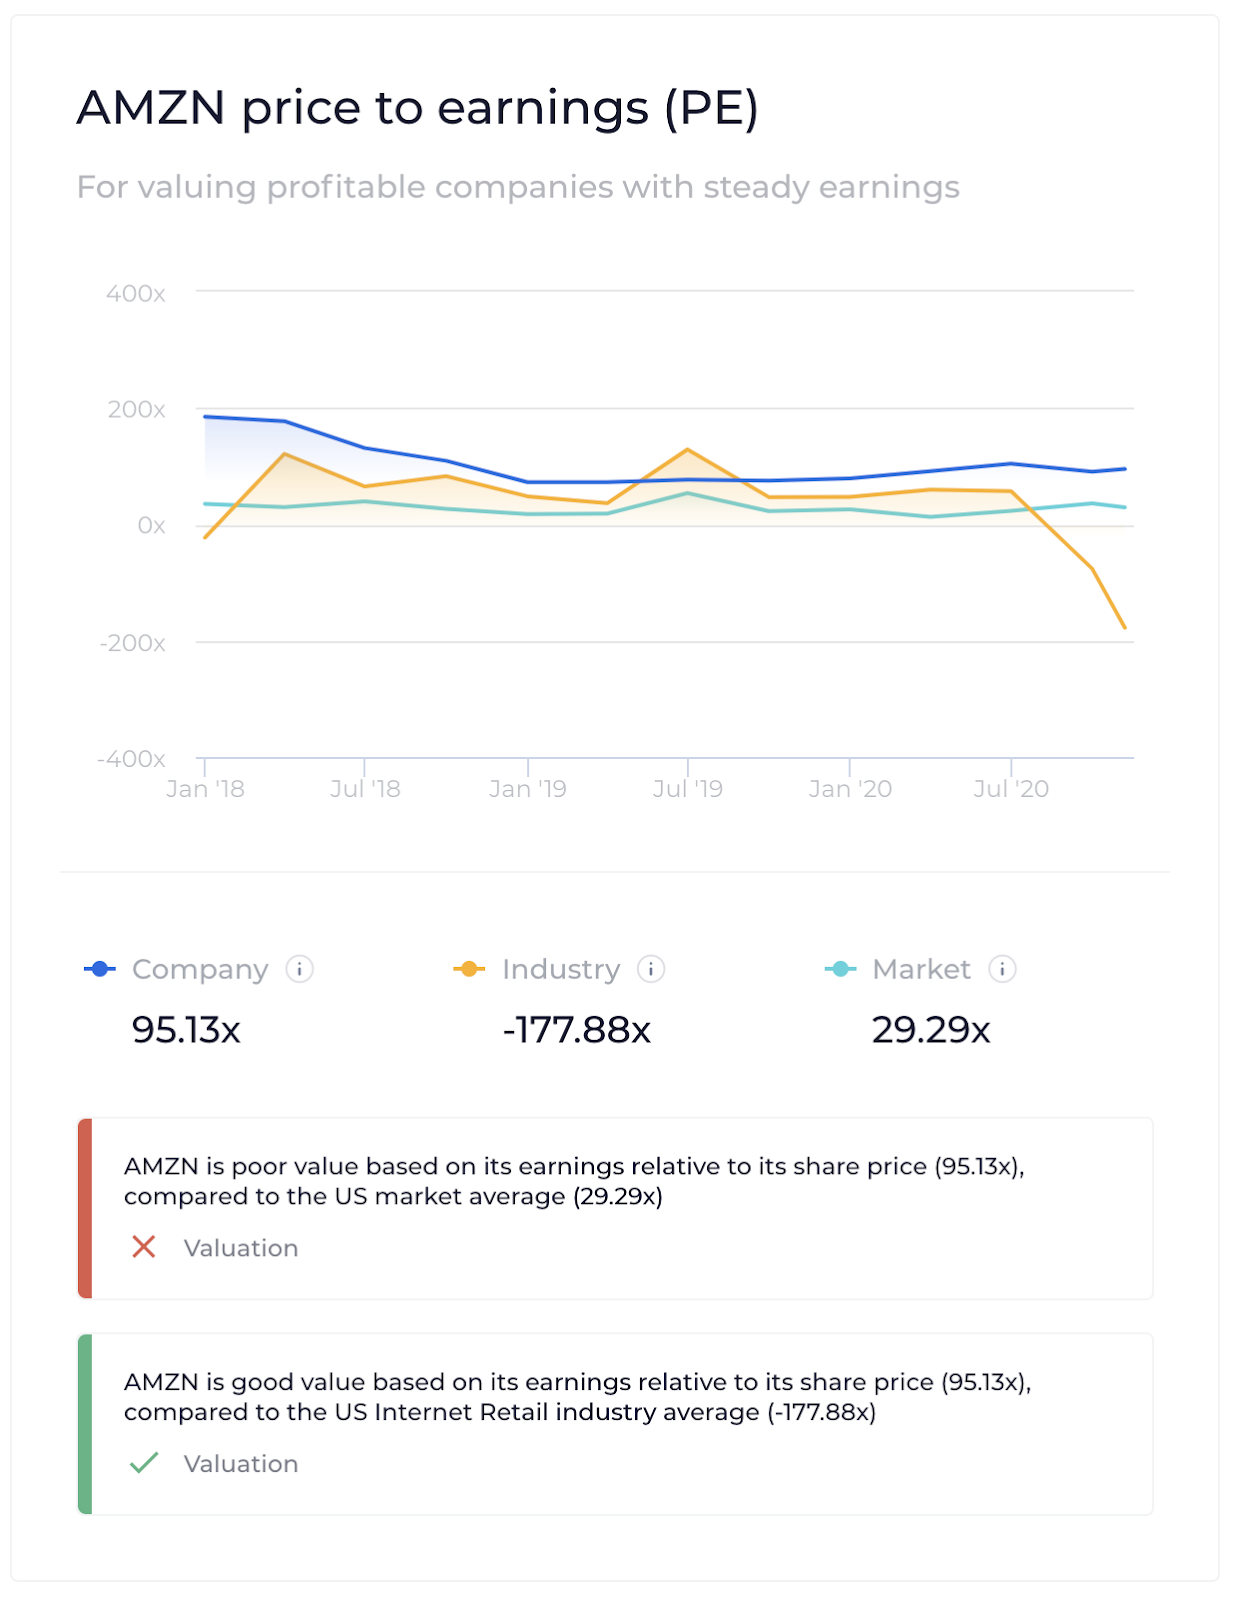
This is how WallstreetZen displays AMZN’s P/E ratio.
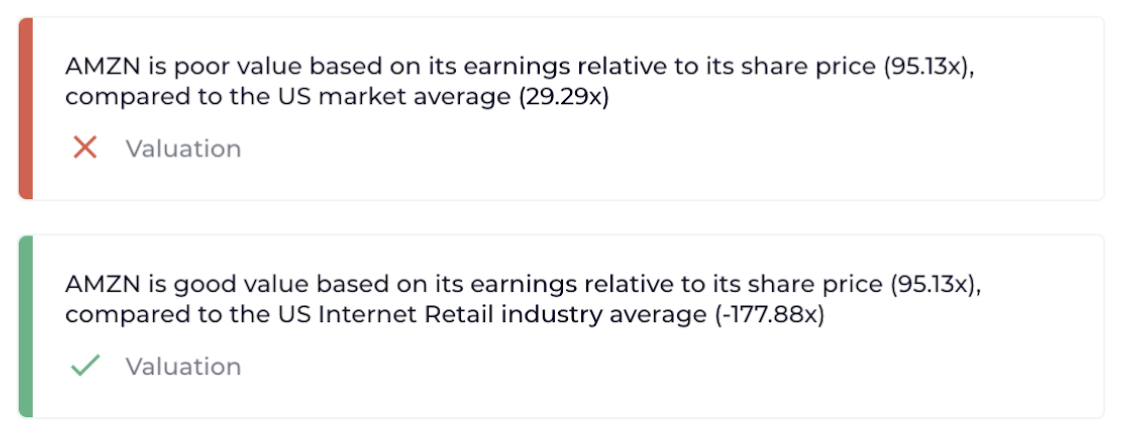
Instead of just a table of numbers, WallStreetZen shows you an intuitive visualization so you can see the historical context of Amazon’s price-to-earnings ratio, charted alongside the average P/E ratio of other US internet retailers and the US market.
WallStreetZen also applies two due diligence checks to compare AMZN’s P/E ratio to the market average and the industry average.
Let’s look at a few other examples of how WallStreetZen makes it easier to quickly analyze companies.
Current ratio
The current ratio is an important liquidity ratio that evaluates a company’s ability to pay its short-term debts i.e. debts that are due within the next year.
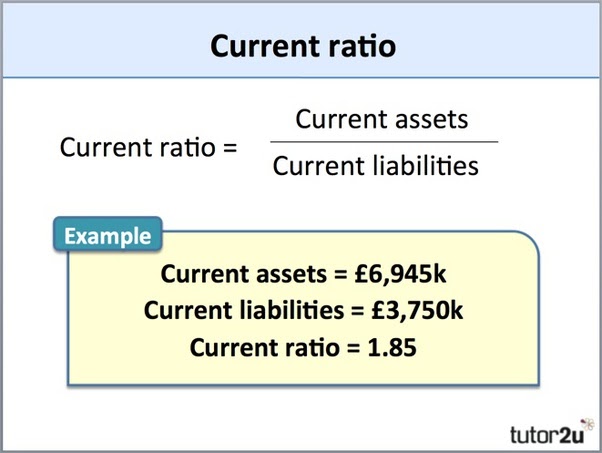
This is crucial to understanding the health of a company’s financials.
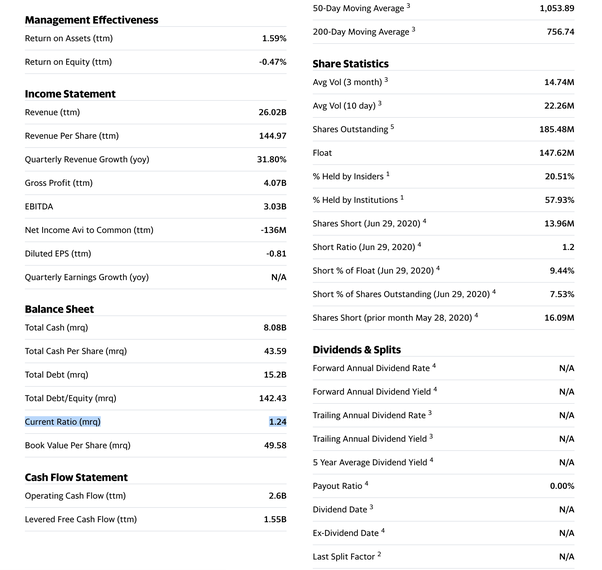
However, the way most stock tracking apps show the current ratio isn’t intuitive, especially to less experienced investors.
Here’s how Yahoo Finance shows you the current ratio for TSLA
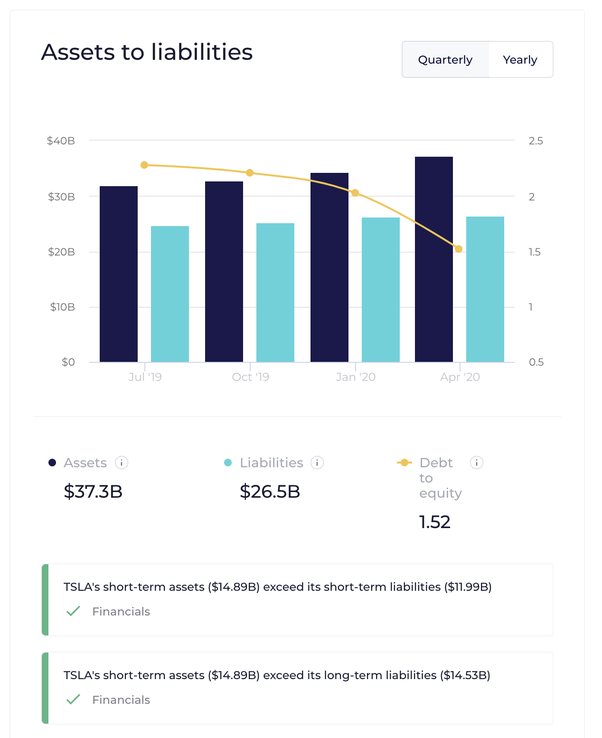
And here’s how WallStreetZen shows you the current ratio for TSLA.
Instead of a single ratio packed into a dense table, WallStreetZen highlights this important financial check as a simple, one-line explanation, underneath an intuitive visualization of TSLA’s assets vs. liabilities.
So even if you’re relatively new to fundamental analysis, you can understand the significance of the current ratio.
We don’t even use the term current ratio here, since it’s not an intuitive term if you’re not familiar with accounting terminology (“current” stands for the current in “current assets” and “current liabilities”, which is accounting speak for “short-term”).
You can get a trial of WallStreetZen Premium here. We believe it’s the best fundamental analysis tool out there that’s designed to be easy to use for part-time investors.
Let’s look at one more example.
Return On Equity
Warren Buffett has stated several times in his letters to shareholders that Return on Equity is one of the most important numbers he looks at.

His entire investing strategy is based on identifying companies with a durable competitive advantage. One of the signs of a durable competitive advantage is if a company has a long history of producing exceptional returns on equity.
This is how Yahoo Finance shows your return on equity for AMZN:
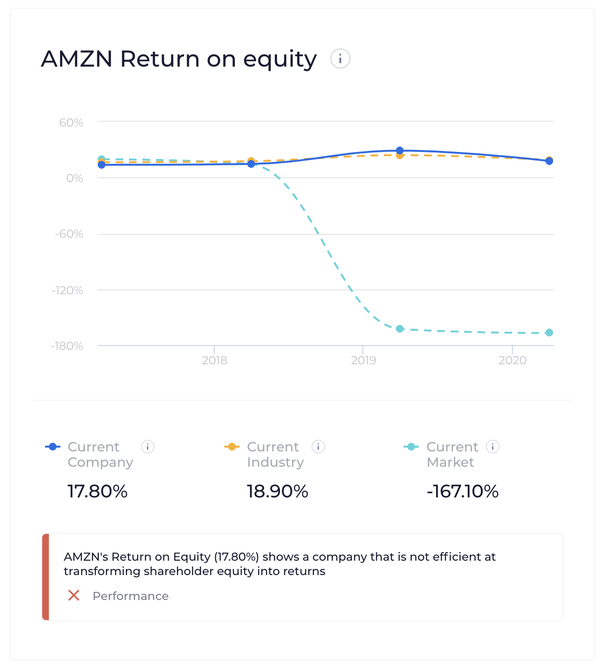
And this is how WallStreetZen shows you the return on equity for AMZN:
Of course, if you dig deeper you would understand that AMZN’s Return on Equity looks weaker than it really is, because they’re constantly reinvesting into long-term revenue growth.
But that’s why it’s important to never look at a single financial ratio in isolation.
Zen Ratings Lets You Quickly Analyze Strengths and Weaknesses
One of WallStreetZen’s best features is the Zen Ratings system.
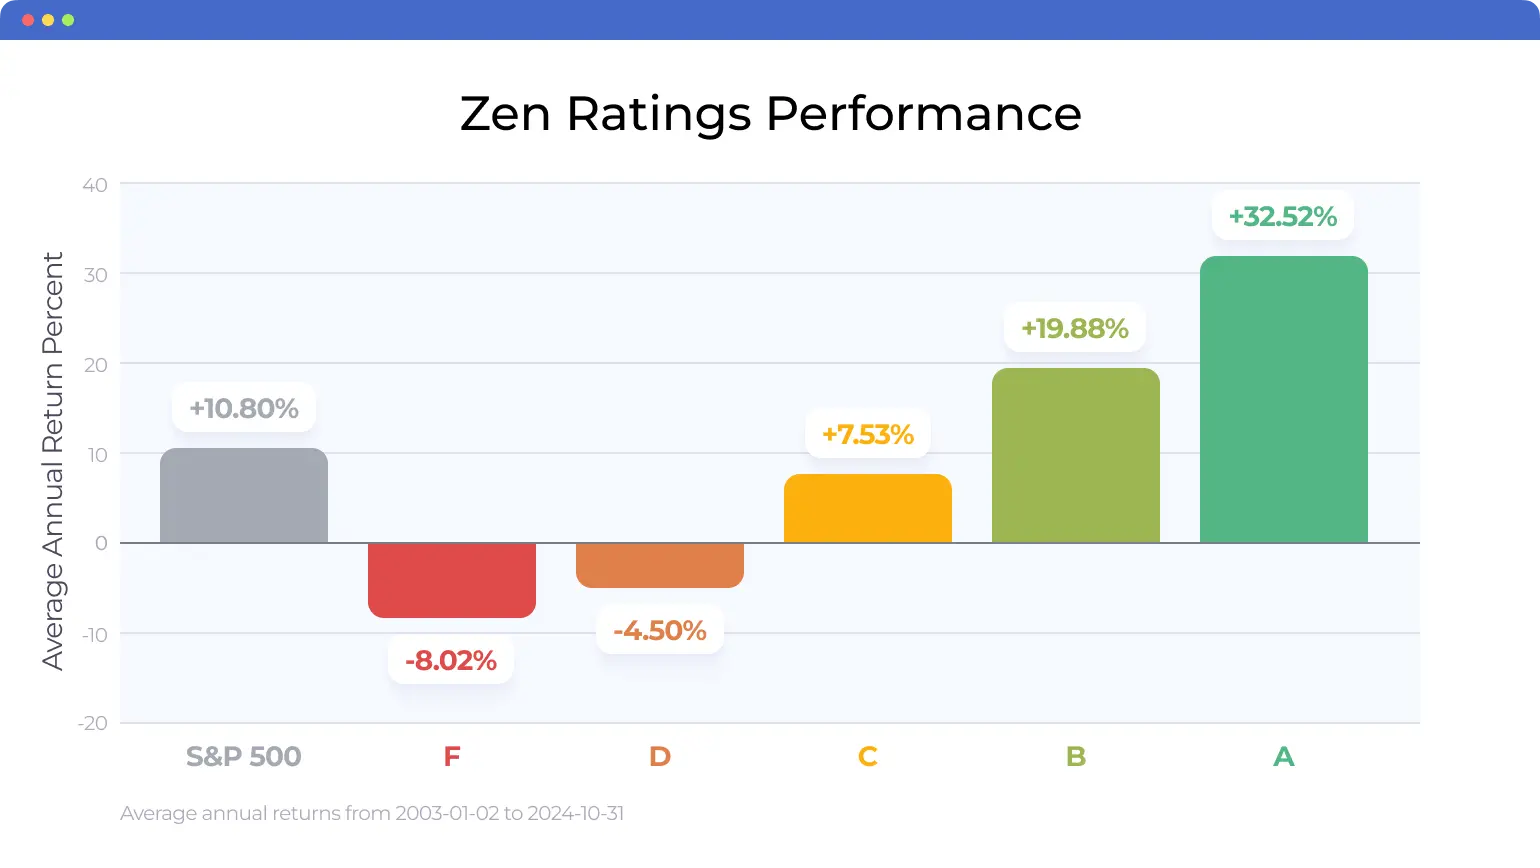
Zen Ratings distills 115 individual factors into a single, easy-to-understand letter grade that designed to make it easy to quickly understand a stock’s fundamental strengths and weaknesses.
So how does it work?
WallStreetZen automates 115 factors that have a historical track record of driving stable growth in stocks — including a layer of proprietary AI technology. It takes checks that experienced investors would usually run using spreadsheets and makes those results accessible by showing them in easy-to-understand, one-line explanations, compiled into a single letter grade. (You can also see the grades for the components that play into the grade.)
This part is particularly impressive: A-rated (Strong Buy) stocks identified using this system have produced an average annual return of +32.52% since 2003.
Although we’re admittedly biased, we really believe that WallStreetZen is the best fundamental analysis software out there if you want to spend less time running numbers, while still gaining important fundamental insights.
Try it now: look up a stock you care about on WallStreetZen to see how Zen Score can help make fundamental analysis easier and faster.
You can also read this post to learn more about Zen Ratings and how it can help make fundamental analysis easier.
WallStreetZen Cost & Pricing
As far as we know, WallStreetZen is the only fundamental analysis tool with such a competitive price…
You can start your trial of WallStreetZen here.
Why is it so affordable?
WallStreetZen’s mission is to help part-time investors make better long-term investment decisions by making it easier to do fundamental analysis.
The best way for us to do this is to provide the lowest-priced product possible (while still covering our data costs and operating expenses), so we can help as many investors as possible. It’s that simple.
You can sign up to start your trial here to start analyzing stocks with WallStreetZen.
We’ve expanded into stock-picking!
With a Zen Investor subscription, you can save precious research time and let a 40+ year market veteran do the heavy lifting for you. Here’s what you get:
✅ Portfolio of up to 30 of the best stocks for the long haul, hand-selected by Steve Reitmeister, former editor-in-chief of Zacks.com with a 4-step process using WallStreetZen tools including the proprietary Zen Ratings system, which boasts average returns of 32.52% annual returns for top-rated stocks
✅ Monthly Commentary & Portfolio Updates
✅ Sell Alerts if the thesis changes
✅ Members Only Webinars
✅ 24/7 access to all the elements noted above
✅ Access to an archive of past trades and commentary.
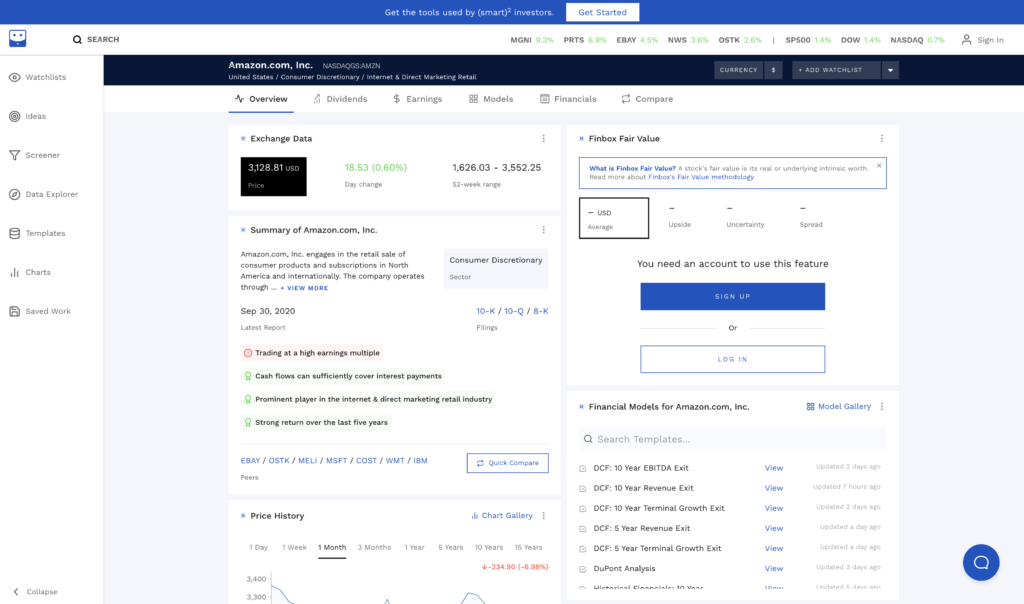
2. FinBox
FinBox is an alumnus of the famed Ycombinator accelerator program, which was an early investor in billion-dollar startups like Stripe, Airbnb, DoorDash, Instacart, and many more.
Out of the four fundamental analysis tools we cover in this article, FinBox is geared toward the most advanced fundamental investors.
FinBox’s Strengths
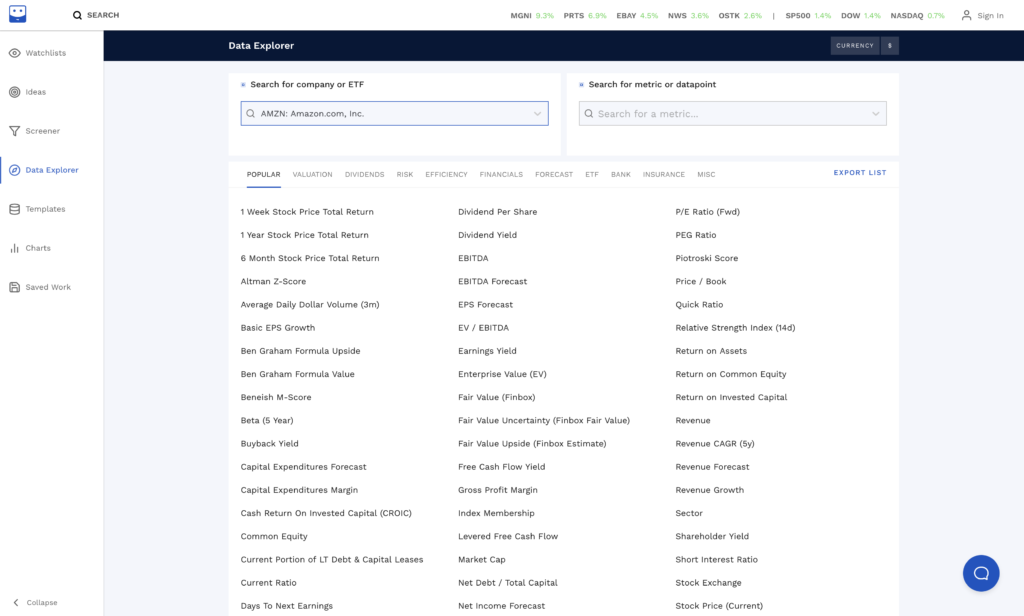
- Incredibly comprehensive – over 900 million data points means that any risk metric or valuation model you can dream of is included
- Highly customizable – all model assumptions can be checked or tweaked
- Global coverage – 100,000 stocks and 135+ exchanges
- Excel add-ons
FinBox is geared towards investors who really care deeply about their data.
Like most YC companies, they’re particularly strong when it comes to engineering. They’ve developed advanced financial modelling technology which allows them to build millions of valuation models a day on the latest data across 100,000+ stocks, generating over 900 million data points (yes, you read that correctly).
Even for experienced investors, it can all be a bit overwhelming, let alone if you’re a relatively new to fundamental analysis.
But if you’re a financial data nerd who loves nothing more than spending time tweaking your DCF models, if you get excited about the nuances of valuation models, if you love nothing more than pushing the capabilities of excel to its limits – then FinBox is likely the best fundamental analysis tool for you.
FinBox Cost & Pricing
Finbox operates on a freemium model, where you can get free access to some limited data and you pay a monthly fee for additional features.
The basic paid plans start at $39 a month, or $240 a year if paid annually, and go upt to $199 a month, or $792 a year.

3. Old School Value
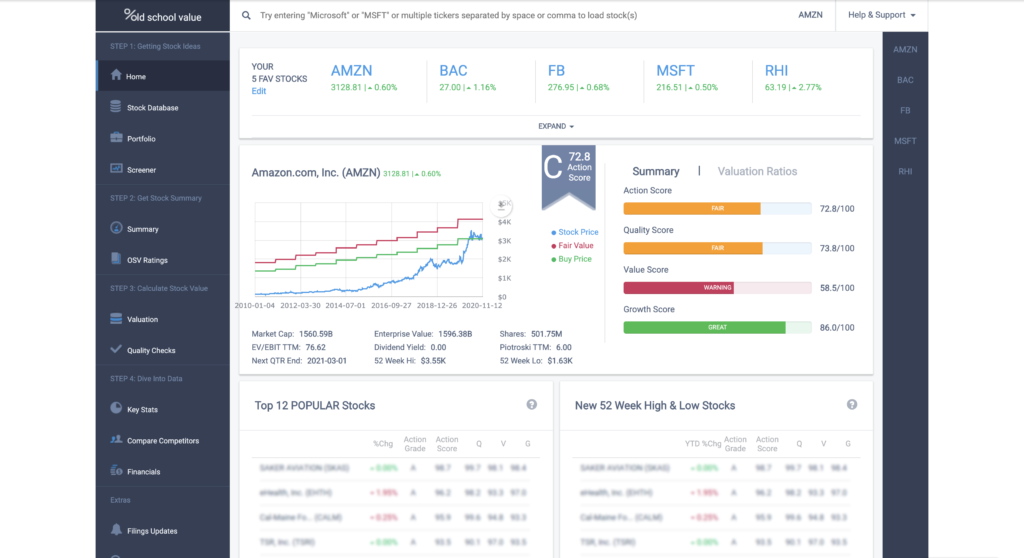
Old School Value was created by experienced value investor Jae Jun, and this deep experience shines through on their website.
Their philosophy is that they’re “Data, Valuation and Fundamentals-Driven”, and they have a great value investing blog that showcases this philosophy, with hundreds of informative value investing articles personally written by Jae.
Old School Value’s Strengths
- Highly customizable
- Stock grades and ratings – help you quickly narrow down stocks and shorten your research time
- For value investors – very tailored towards a valuest investing work flow
- Informative blog – lots of in-depth information on value investing for both beginners and experienced investors
Like we do here at WallStreetZen, Old School Value applies proven models by famed value investors like Ben Graham and Edward Altman to score individual stocks.
Their biggest selling point is their Stock Grades scoring system.
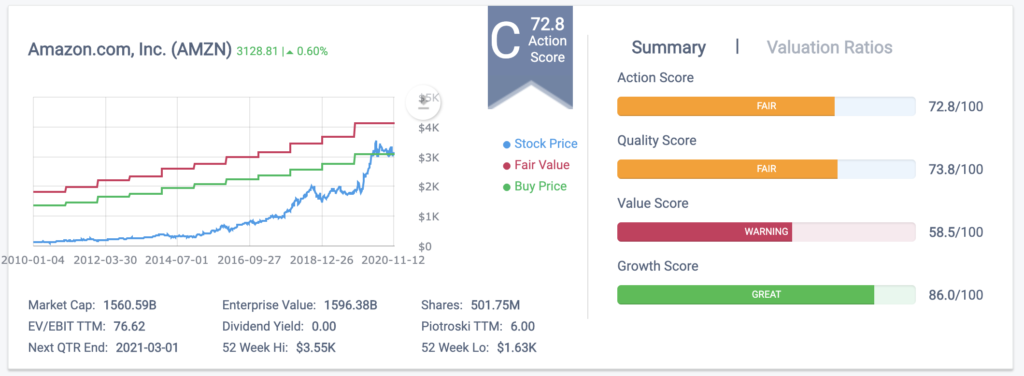
This automation of important checks can help users drastically reduce their research time.
The creators of this fundamental analysis platform have a deep understanding of the nuanced challenges facing modern value investors, and it shines through in the software.
For example, instead of showing a single fair value, they acknowledge that valuation can be a tricky business, and so their software allows you to simulate a bear, base and bull valuation to come up with a realistic range.
Old School Value Cost & Pricing
Unlike WallStreetZen which is 100% free at the moment, Old School Value requires a monthly subscription.
However, if you want to go more in-depth and do more customized analysis, the extra cost may be worth it to you.
Old School Value costs $59 a month if you pay monthly, or $588 if you pay for a full year up front, which works out to $49/month.
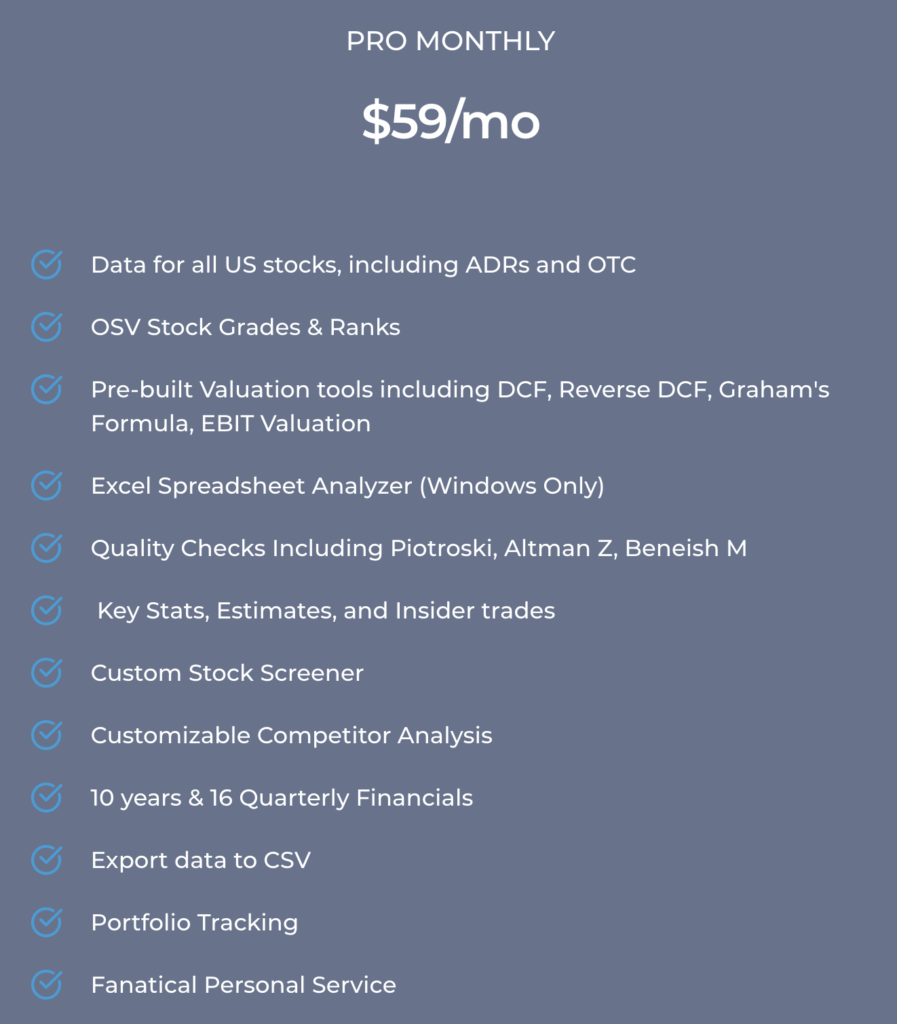
While $588 per year is a significant investment for fundamental analysis software, they do let you test drive the product to see if it’s the right fundamental analysis software for you.
You can view a demo of the software here, and they also offer a 7-day free trial (credit card required).
As of the time of writing, Old School Value only covers US stocks.
4. SimplyWall.St
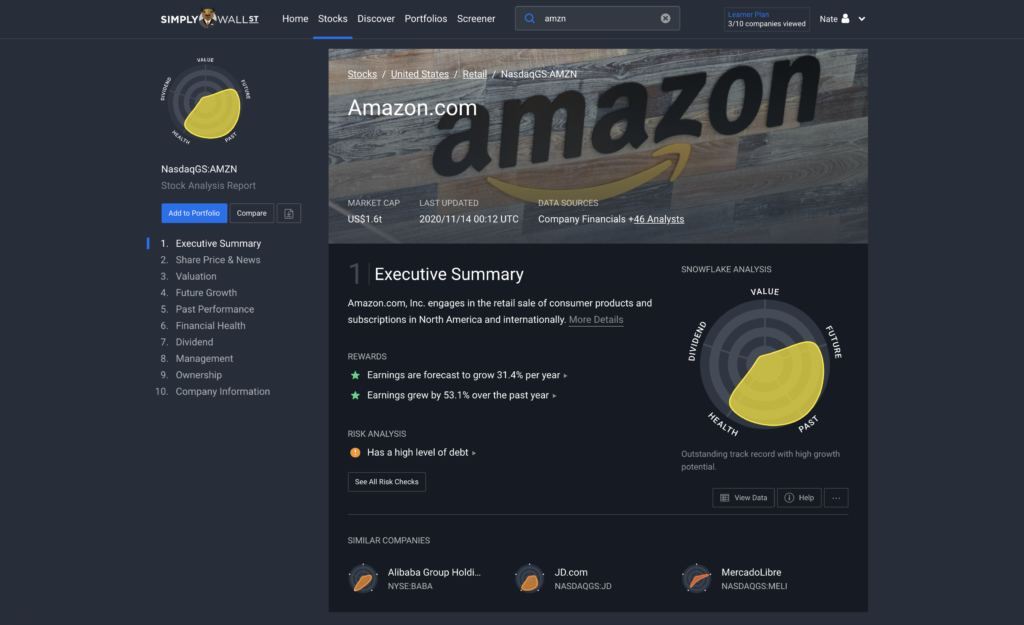
The first thing you’ll notice about SimplyWall.St is that it’s quite visually stunning – they present stock fundamentals via beautiful infographics, and it’s a refreshing change.
SimplyWall.St’s Strengths
- Global coverage
- Their Snowflake helps you quickly analyze a stock’s strengths and weaknesses
- Beautiful, intuitive infographics of important data
- Automated risk checks help you quickly understand a company’s fundamentals
- Opinionated, single page workflow that guides you through their fundamental analysis checklist
SimplyWall.st is not laid out like most of the best stock research sites, which can be a little bit disorienting at first, but once you understand the logic behind how things are laid out, this can be a good thing – especially if you’re new to fundamental analysis.
Unlike most fundamental analysis websites which show you data in various tabs, each stock on SimplyWall.st is covered on a single page.
Each page was designed around a fundamental analysis workflow – scrolling from top to bottom takes you through what is essentially a very thorough fundamental analysis checklist.
For example, you start with SimplyWall.st’s “snowflake”, and risk checks
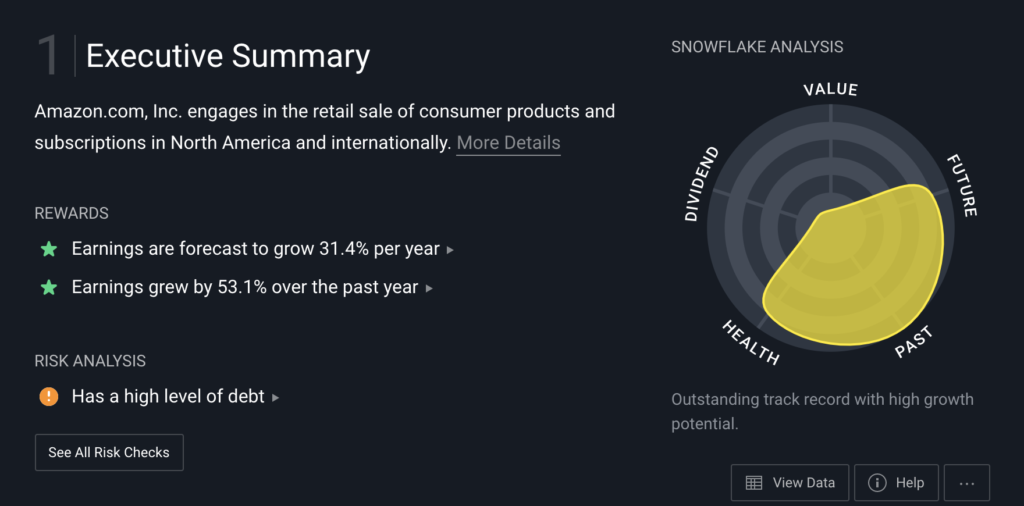
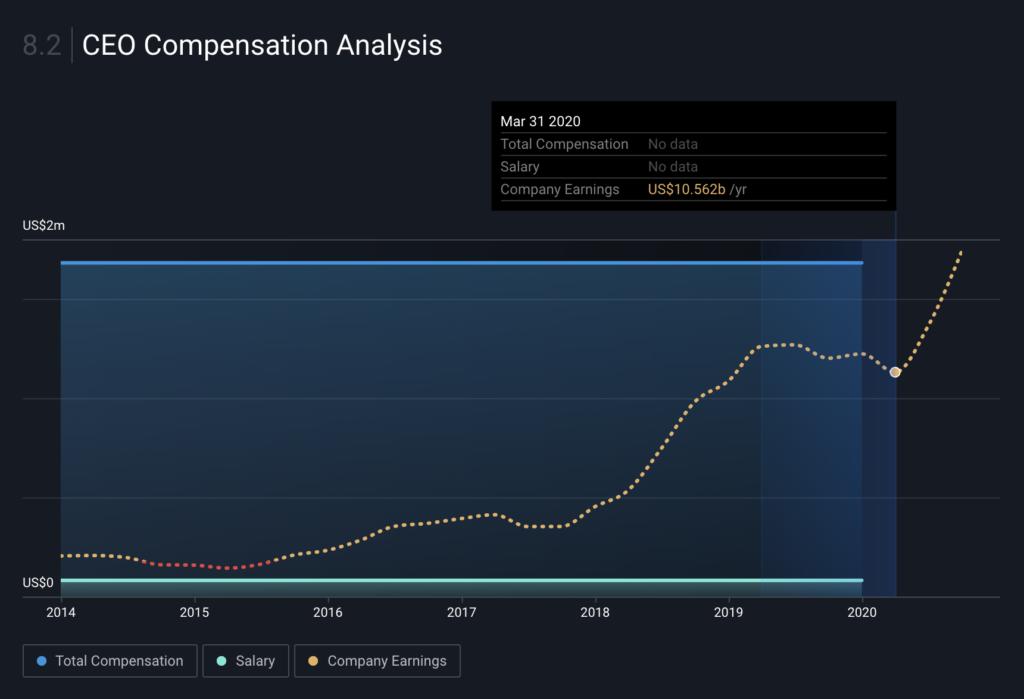
Then you move onto other aspects of analysis, including valuation, financial health, dividends, and even down to the nitty gritty of CEO compensation vs. company growth, which isn’t a metric I’ve seen on any other fundamental analysis websites.
SimplyWall.St Cost & Pricing
SimplyWall.St is a paid subscription software product, but it is cheaper than Old School Value and Finbox. It’s targeted towards investors who prioritize ease of use vs. customizability.
SimplyWall.st costs $115 a year for its Investor plan, and $305 a year for its Professional plan.
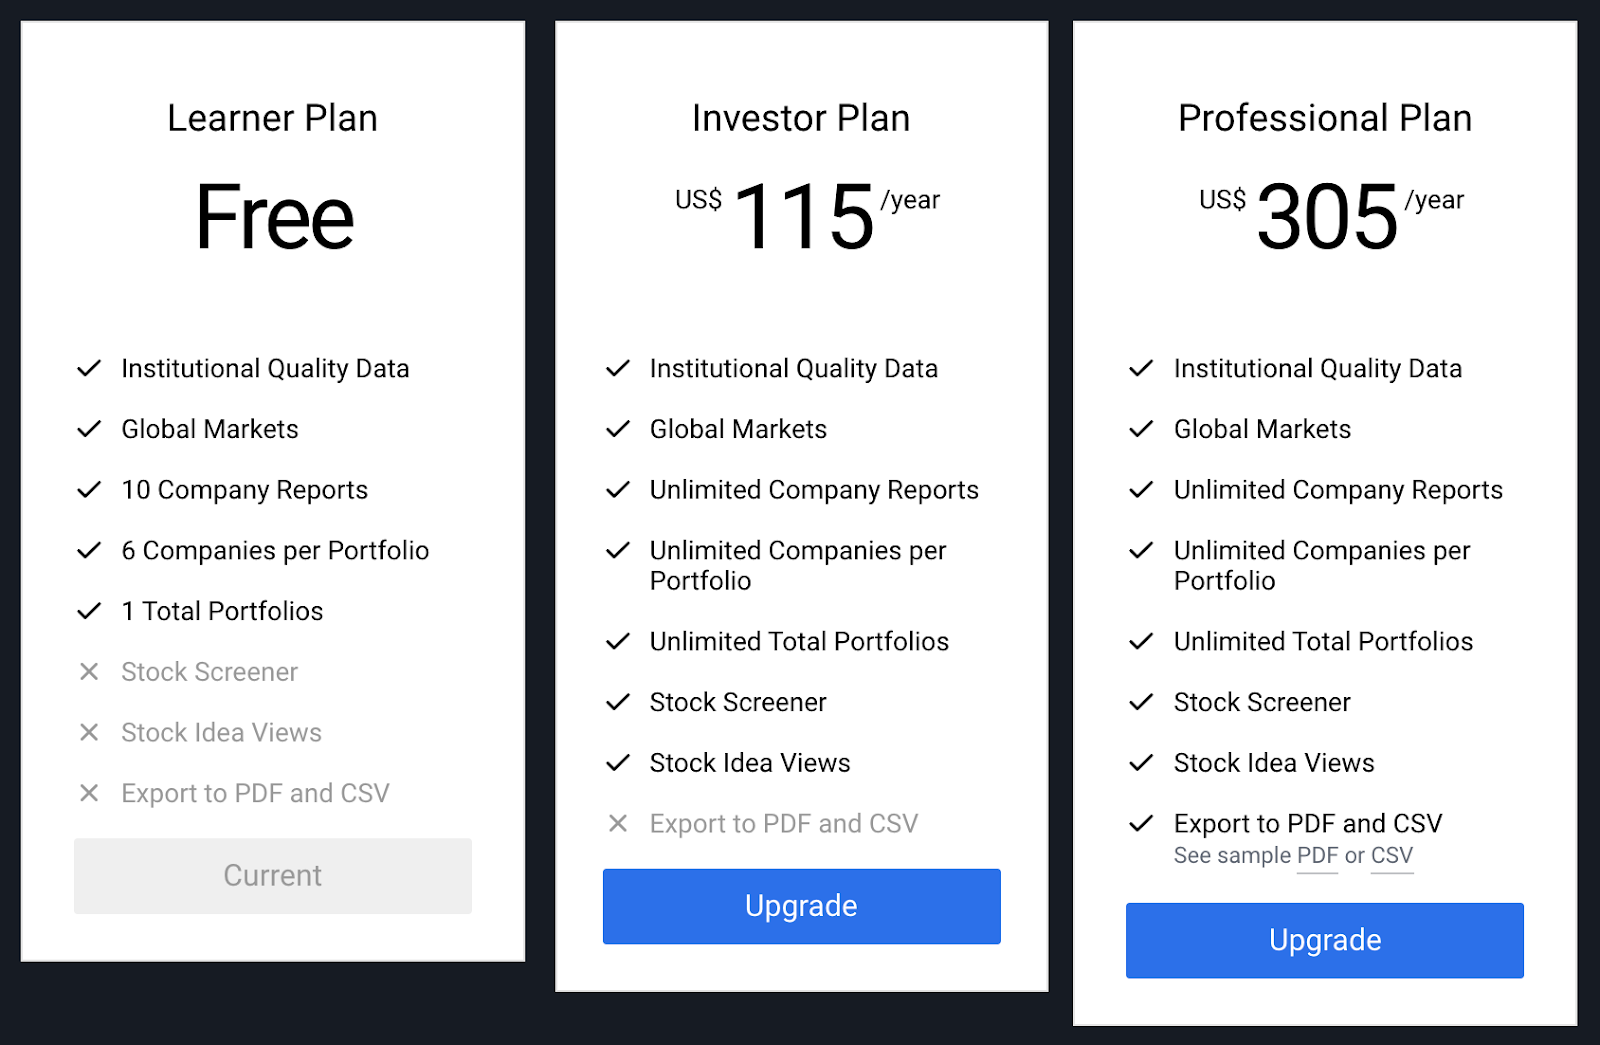
However, unlike Old School Value and Finbox, SimplyWall.st does not offer a monthly payment option.
Also, it’s worth noting that they often run promotions giving you up to 30% off the investor plan, so you can sign up for the free tier, and wait for a promotion to get started.
Speaking of free, while Simplywall.st does offer some free functionality, the free tier really serves as a way for you to get your feet wet and try out the product
With a limit of only 10 company searches a month and no stock screener access, it’s too limited to allow you to really use it as your primary, everyday research tool without signing up for a paid plan.
This isn’t necessarily a bad idea – they have a great product at a fair price!
At that lower price point, you also get less customizability than tools like Finbox or OldSchoolValue, but you get a really beautiful interface and it’s extremely easy to understand, making it ideal for newer investors, and more advanced investors who value simplicity and saving time.
Which Fundamental Analysis Tool is the Best for You?
If you want a balance of advanced functionality with ease of use and you invest primarily in US stocks, WallStreetZen is the best fundamental analysis tool for you (although we’re obviously biased, that’s what we truly believe).
WallStreetZen also offers the most extensive free functionality out of the 4 fundamental analysis tools we covered.
SimplyWall.St and Old School Value also offer a nice mix of advanced functionality with ease of use, with Old School Value offering more customizability and in-depth features for advanced value investors, but only covering US stocks, while SimplyWall.st offers global coverage and is more approachable for newer investors.
Old School Value’s increased customizability also comes with a higher price tag ($588/year vs $115/year).
At its lower price point, SimplyWall.st offers more simplicity, ease of use, and comprehensive global stock coverage.
However, if you’re the type of investor who spends hours tweaking your assumptions and valuation models and you’re willing to pay for the most comprehensive data, then FinBox might be the best fundamental analysis tool for you.
The best way to decide which fundamental analysis tool is right for you is to try them out and see which one suits you best. And since you’re already here, why not start with WallStreetZen?
You can sign up here (it’s free) to get started.
Interested in premium services? Read our review of Motley Fool vs Zacks vs Morningstar vs Seeking Alpha.
Where to Invest $1,000 Right Now?
Did you know that stocks rated as "Buy" by the Top Analysts in WallStreetZen's database beat the S&P500 by 98.4% last year?
Our July report reveals the 3 "Strong Buy" stocks that market-beating analysts predict will outperform over the next year.

