Jessie Moore has been writing professionally for nearly two decades; for the past seven years, she's focused on writing, ghostwriting, and editing in the finance space. She is a Today Show and Publisher's Weekly-featured author who has written or ghostwritten 10+ books on a wide variety of topics, ranging from day trading to unicorns to plant care.
The swing trading timeframe you choose can be the difference between success and failure.
But how do you know what swing trading timeframe to choose? Is there a best timeframe for swing trading? The short answer is yes — and it could be holding you back if you’ve made the wrong choice.
In this article, I’ll cover the best timeframe for swing trading, complete with real-life examples of why it’s the best.
However, I understand that everyone’s personality and strategy are different. So you’ll also learn about other swing trading time frames so you can decide for yourself.
Now, let’s discover the best swing trading timeframe.
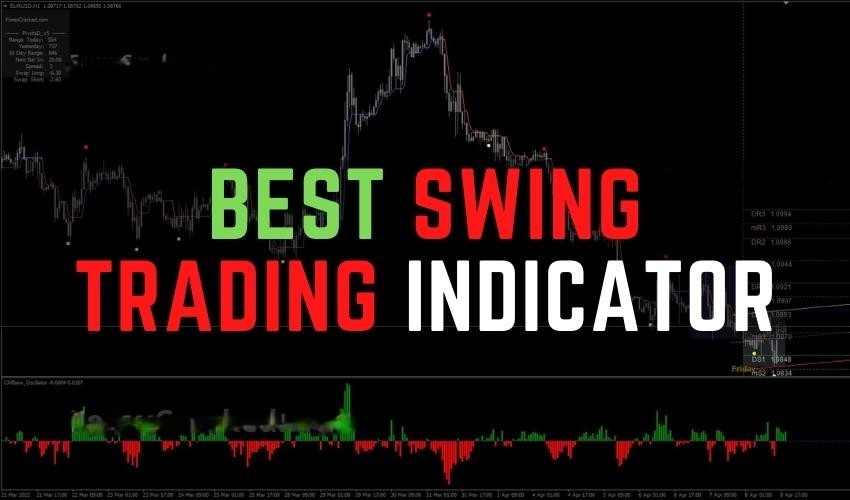
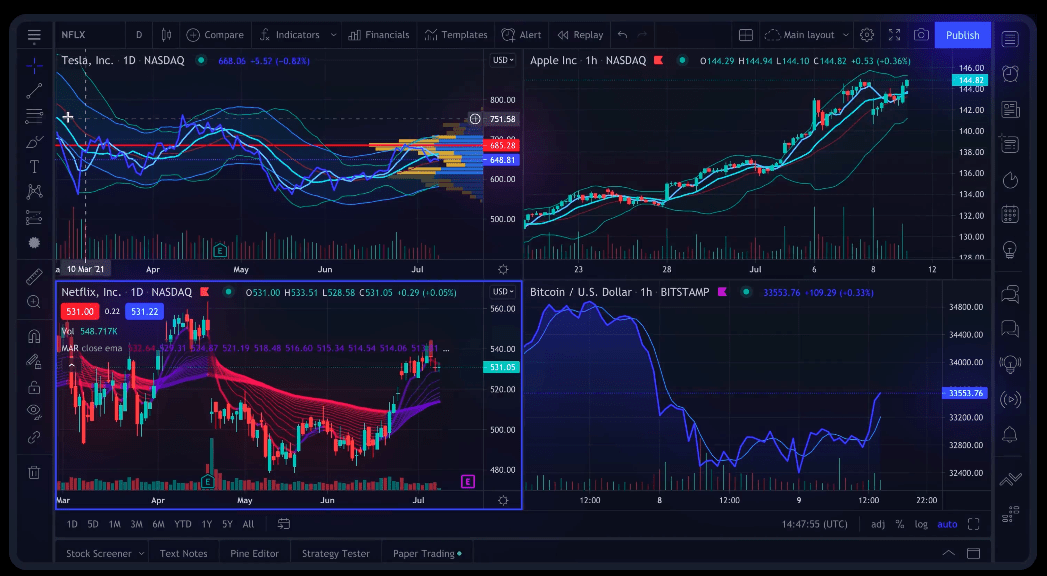
TradingView is my favorite charting platform for day trading.
What is the Best Time Frame for Swing Trading?
In my opinion, the best timeframe for swing trading is the daily chart. It fits the regular cadence of our world, helping you build a consistent trading routine, and giving you the greatest chance of success.
Why?
Because of the five reasons I’ll break down below…
Why the Daily Timeframe is the Best for Swing Trading
Trading on the daily timeframe allows you to step out of the “noise” of a single local trading session and base your trades on developments across the world.
Reliable, tradable swings happen when global market participants have ample time to weigh and act on the day’s news and events. So it makes sense to see how every financial hub reacts during their individual trading sessions, culminating in a single daily bar or candlestick.
In this section, I’ll expand on this reason, along with four others that include better work-life balance, lower trading costs, and improved trade execution.
1. It’s Reliable and Less Random
The lower the time frame, the more random the price action becomes. This is because it takes much less buying (or selling) pressure to move the markets.
Consider the screenshot below:
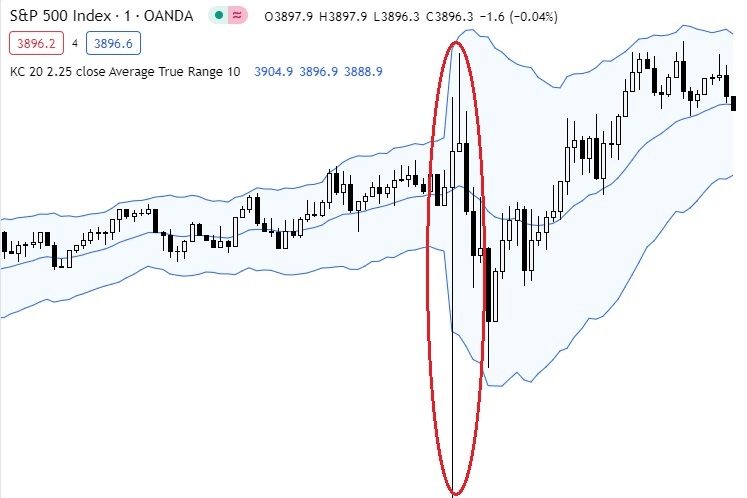
In this instance, price action was extremely volatile on the one-minute chart, printing a $50 price swing in just two minutes.
But when you zoom out to the daily chart during the same time, it looks like business as usual:
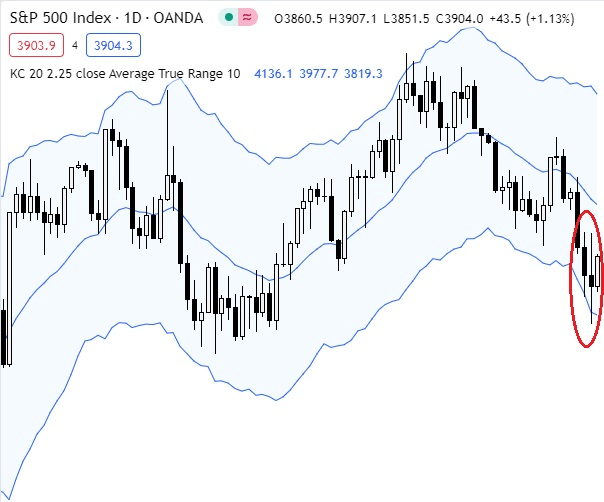
Overall, the lesson here is that enduring, reliable trends are created when a significant amount of capital is positioned in the same direction. And the best place to gauge this positioning is on the daily chart.
Why?
Large funds (you know, the ones that move billions of dollars!) have to deploy their capital over a larger time period or they risk moving the market too much in a single day. But over days and weeks, this posts reliable patterns on higher timeframes.
On top of this, macroeconomic factors (the main driver of financial markets) play out over months and years, not hours and days.
So if you want to position yourself on the side of meaningful price action, the daily timeframe is the best chart for swing trading.
The Ultimate Day Trading Setup
- The best brokerage for day trading: TradeStation
- The best day trading ecourses & community: Investors Underground
- The best day trading computer: Radical X13
- The best charting platform: TradingView
2. Trade Execution is Easier
Trade execution is often an afterthought to traders. They liken it to “just clicking a few buttons.” But in reality, it’s much more than that.
Your trade execution includes all the decisions you’ve made leading up to the final clicks in your trading platform. It also includes the choices you’ll have to make while your position is running and when you want to exit.
Every one of these decisions comes at a cost because it increases your cognitive load — a fancy way of saying mental effort.
When you trade on lower timeframes, your cognitive load is exponentially higher because you’re always tuned into the markets. Consequently, you tire out quicker, and efficient trade execution becomes more difficult.
When it becomes too much, it can make you feel like this:
In contrast, swing trading on the daily timeframe means you have a lot more time to make decisions.
You don’t have to sit still and stare at charts until your eyes are dry. Simply flick through your shortlist anytime before the open and place your trades without time pressure.
Not only is this less stressful for you, but it can also improve your decision-making because you have hours to analyze the latest fundamentals and price action. It can also reduce your mistakes since you have the luxury to double or even triple-check your numbers.
That’s why the daily is the best chart time frame for swing trading.
3. It Improves Your Work-Life Balance
Since you’re not stuck watching every single tick while the markets are open, trading on the daily timeframe can significantly improve your work-life balance.
Sure, when you’ve got trades open there’s always a tendency to want to check on the markets all the time. But it’s not a must. That’s the difference.
It’s your choice if you want to check the markets more than once per day — a much better alternative than being glued to your chair. For example, if you trade on a 5-minute chart, you have to be dialed in during the whole session. Sometimes you can’t even get a glass of water if a setup is developing!
Outside of general comfort, swing trading on the daily timeframe gives you back much-needed free time that you can spend with friends and family.
Not only does this free time lead to a more fulfilling life, but it also benefits your trading by lowering stress and improving your mood, putting you in a state of trading zen.
Finally, more free time means more time to research stocks and study the art and science of trading.
Swing trading the financial markets is an ever-evolving job. There are no standard operating procedures that will work forever so you have to continue learning to ensure your strategies perform as they should.
And you can do all of this in much less than 40 hours per week on the daily timeframe whereas trading on shorter timeframes could easily work out to more than a full-time job!
4. You Can Trade With a Smaller Account
In a bid to maximize their returns, many swing traders choose to trade shorter timeframes because “the more chances I have the more money I can make.”
The problem? If you’re trading stocks with limited leverage, you can easily run out of deployable capital.
For example, if you were swing trading pullbacks on a 5-minute S&P 500 chart, you’d probably have a stop-loss of roughly 40 ticks ($4) from your entry. Now, if you had a $4,000 account and wanted to risk 1% of your capital, you’d need to buy or sell 10 shares, which is impossible unless you have sufficient leverage.
In contrast, if you were trading the same strategy on the daily timeframe, your stop loss would be roughly 500 ticks ($50) away from your entry.
This means that with your same $4,000 account you could in fact trade the daily pullback even if you had no available leverage.
In saying that, there may be other stocks that are better suited to short-term swing trading, such as Amazon.
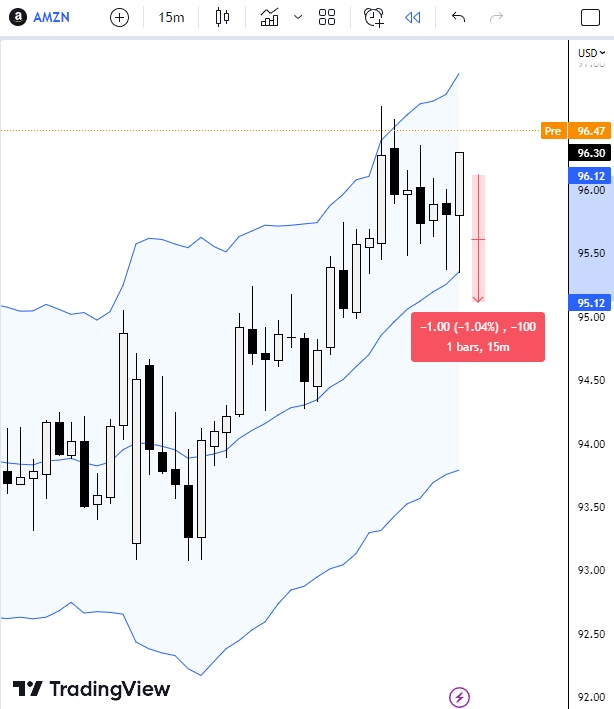
We’re a bit late in this instance, but if you wanted to trade this 15-minute pullback, you’d likely have a stop roughly 100 ticks ($1) away from your entry.
Now, if you wanted to risk 1% of your $4,000 account ($40), you’d need to buy 40 shares, which would cost around $3,844 — manageable with a $4,000 account.
But overall, the principles are the same. A longer swing trade timeframe allows you to trade with a smaller account balance while respecting risk.
5. Lower Trading Costs
There are only two guarantees in life: death and taxes (paying the spread).
And the fact is, swing traders have a significant hurdle to overcome if they choose the wrong swing trading timeframe — trading costs.
Why?
The spread becomes a larger percentage of your investment costs when you trade on lower timeframes, which right now for the S&P 500 is around $0.6.
Now, there are ways to avoid paying the spread, such as using limit orders. But most traders only use these for their entries since they want to get out quickly when they’re wrong.
Let’s use the S&P 500 example from above to demonstrate the savings of daily timeframe trading.
If the spread is $0.6, it means you lose $0.3 when you market buy or sell one share. So if you were to trade 10 shares, you’d be paying $3 which works out to 7.5% of your risk ($40).
But when executing the trade on the daily timeframe your trading cost will only work out to 0.75% of your trade for the same amount of risk (0.3/40) because you’re only trading one share.
So by swing trading on the daily timeframe, you could potentially increase your profitability by a significant margin simply because you pay lower trading fees.
Other Notable Swing Trading Time Frames
While I recommend that swing traders stick to the daily timeframe, it’s not the only option.
To be transparent, the best chart for swing trading is the one that works for you. It’s possible to make money swing trading on any timeframe as long as it suits your strategy.
But in general, these are your best swing trade time frame alternatives:
4-Hour Chart
The 4-hour timeframe is one of the best time frames for swing trading outside of the daily timeframe. It not only provides you with more chances to apply your edge, but it still keeps your trading costs at a reasonable level.
Using the spread above, your trading costs would likely work out to a similar number as trading on the daily timeframe (roughly 1% of your risk).
As a swing trade time frame, the 4-hour chart is also relatively reliable as patterns play themselves out over multiple days. This means you’re less susceptible to acting on random, emotion-driven price action during a single trading session.
Weekly Chart
The weekly chart is another of the best time frames for swing trading as it matches the unfolding of real economic drivers, such as inflation.
It keeps you out of the noise of news releases on lower timeframes while positing your trades with large institutions that deploy capital over weeks and months.
However, swing trading on the weekly timeframe means your positions will be open for months at a time. This is fine for most people, but if you’re someone who worries about open trades or who always needs to be trading, the slow pace can be a negative.
1-Hour Chart
This is another popular chart for swing traders for the same reasons that people trade the 4-hour chart.
But the problem here is that trading costs start to become a bigger portion of your profits—roughly double what you’d pay on the four-hour and daily timeframes.
Price action also starts to get a bit messier as moves happen over a single trading session (think NY, Asia, etc.) and can be the result of overreactions to the news.
Final Word: The Best Timeframes for Swing Trading
What is the best time frame for swing trading? It should be pretty clear by now that I think the best time frame for swing trading is the daily chart because it aligns your swing trades with the global macroeconomic environment.
It also gives your bottom line an instant boost by lowering your trading costs relative to your profit margin while giving you more time to study trading and improve your strategies.
But swing trading on the daily timeframe isn’t an edge in and of itself…
You still need to do your analysis—and that’s where WallStreetZen comes in.
Instead of wasting hours dealing with spreadsheets, CSV files, and Yahoo Finance to find opportunities, you can use our free stock screener to find swing trading opportunities that suit your style based on your personalized filters.
FAQs:
Which timeframe is best for swing trading?
The best time frame for swing trading is the daily chart because price action is more reliable and trading costs are lower. It also makes trade execution easier and improves your work-life balance because you don’t have to be glued to your laptop 24/7.
Is the 4-hour chart good for swing trading?
The 4-hour chart is a good alternative to the daily swing trading timeframe. While price action is slightly more random than the daily timeframe, this chart gives you more opportunities to trade which can increase profitability.
Where to Invest $1,000 Right Now?
Did you know that stocks rated as "Buy" by the Top Analysts in WallStreetZen's database beat the S&P500 by 98.4% last year?
Our July report reveals the 3 "Strong Buy" stocks that market-beating analysts predict will outperform over the next year.