Jessie Moore has been writing professionally for nearly two decades; for the past seven years, she's focused on writing, ghostwriting, and editing in the finance space. She is a Today Show and Publisher's Weekly-featured author who has written or ghostwritten 10+ books on a wide variety of topics, ranging from day trading to unicorns to plant care.
The Bottom Line: Is Stock Analysis Worth It?
StockAnalysis.com is an outstanding tool if you want to cut through the noise and get straight to the facts and numbers behind thousands of stocks and ETFs. The website speed alone earns it a permanent bookmark in my browser. I still use it for quick data checks even when I’ve got other platforms open.
However, the platform’s biggest strength, raw data without interpretation, is also its biggest weakness. I found that Stock Analysis does a great job of telling me the what, but not the why.
That’s why I find that the ideal way to use it is in tandem with WallStreetZen, so I can get quick data lookups from Stock Analysis, then context and analysis from WallStreetZen’s Zen Ratings and analyst insights.
My Suggestion: If you’re a data-driven investor who likes drawing your own conclusions, try the free version. See if the interface clicks for you. The Pro plan at $79/year is reasonable if you end up using it regularly.
Stock picks from a 40+ year investing veteran
With a Zen Investor subscription, you can save precious research time and let a 40+ year market veteran do the heavy lifting for you. Here’s what you get:
✅ Portfolio of up to 30 of the best stocks for the long haul, hand-selected by Steve Reitmeister, former editor-in-chief of Zacks.com with a 4-step process using WallStreetZen tools
✅ Monthly Commentary & Portfolio Updates
✅ Sell Alerts if the thesis changes
✅ Members Only Webinars
✅ 24/7 access to all the elements noted above
✅ Access to an archive of past trades and commentary.
Why I Tried StockAnalysis.com
I’ve wasted more hours than I care to admit on clunky financial websites. While Yahoo Finance is the go-to platform for several stock market investors, users are bombarded with ads, making the experience tiresome.
There are several other “professional terminals” where you may need three monitors and a finance degree just to figure out where they hide the P/E ratio.
Last month, while researching a tech stock, I stumbled upon StockAnalysis.com. The first thing that struck me was the absence of pop-ups and aggressive upsells — just clean, simple data.
I spent the next few weeks putting this platform through its paces with real money on the line. This StockAnalysis.com review covers what I found: the good, the frustrating, and whether you should bother signing up.
What Stock Analysis Is (and Isn’t)
Kris Gunnars launched StockAnalysis.com back in 2019. His pitch was straightforward: most retail investors don’t need another bloated platform. They need fast, accurate data without the circus.
(A few more fun facts about Gunnars: He holds a Bachelor’s degree in medicine from the University of Iceland, and it’s not his real name — it’s a pen name. His full name is Kristjan Mar Gunnarsson.)
The site covers over 100,000 stocks and funds globally. You get access to financial statements, screening tools, and real-time market data. The site is robust and uploads in about a second, which sounds trivial until you’ve sat through Yahoo Finance’s glacial page refreshes.
You won’t find lengthy articles about “10 Hot Stocks to Buy Now.” (If you want a weekly list of 5 high-conviction stocks to watch, you can subscribe to our free newsletter.)
Further, there are no community forums where anonymous traders argue about meme stocks or an AI chatbot pretending to be your financial advisor.
StockAnalysis.com app review users consistently mention one thing: the platform trusts you to look at numbers and help you make an investment decision.
Notably, there’s no StockAnalysis.com API. Their data licensing agreements block programmatic access, and developers looking to pull data into their own apps will have to shop elsewhere.
My Experience Using Stock Analysis
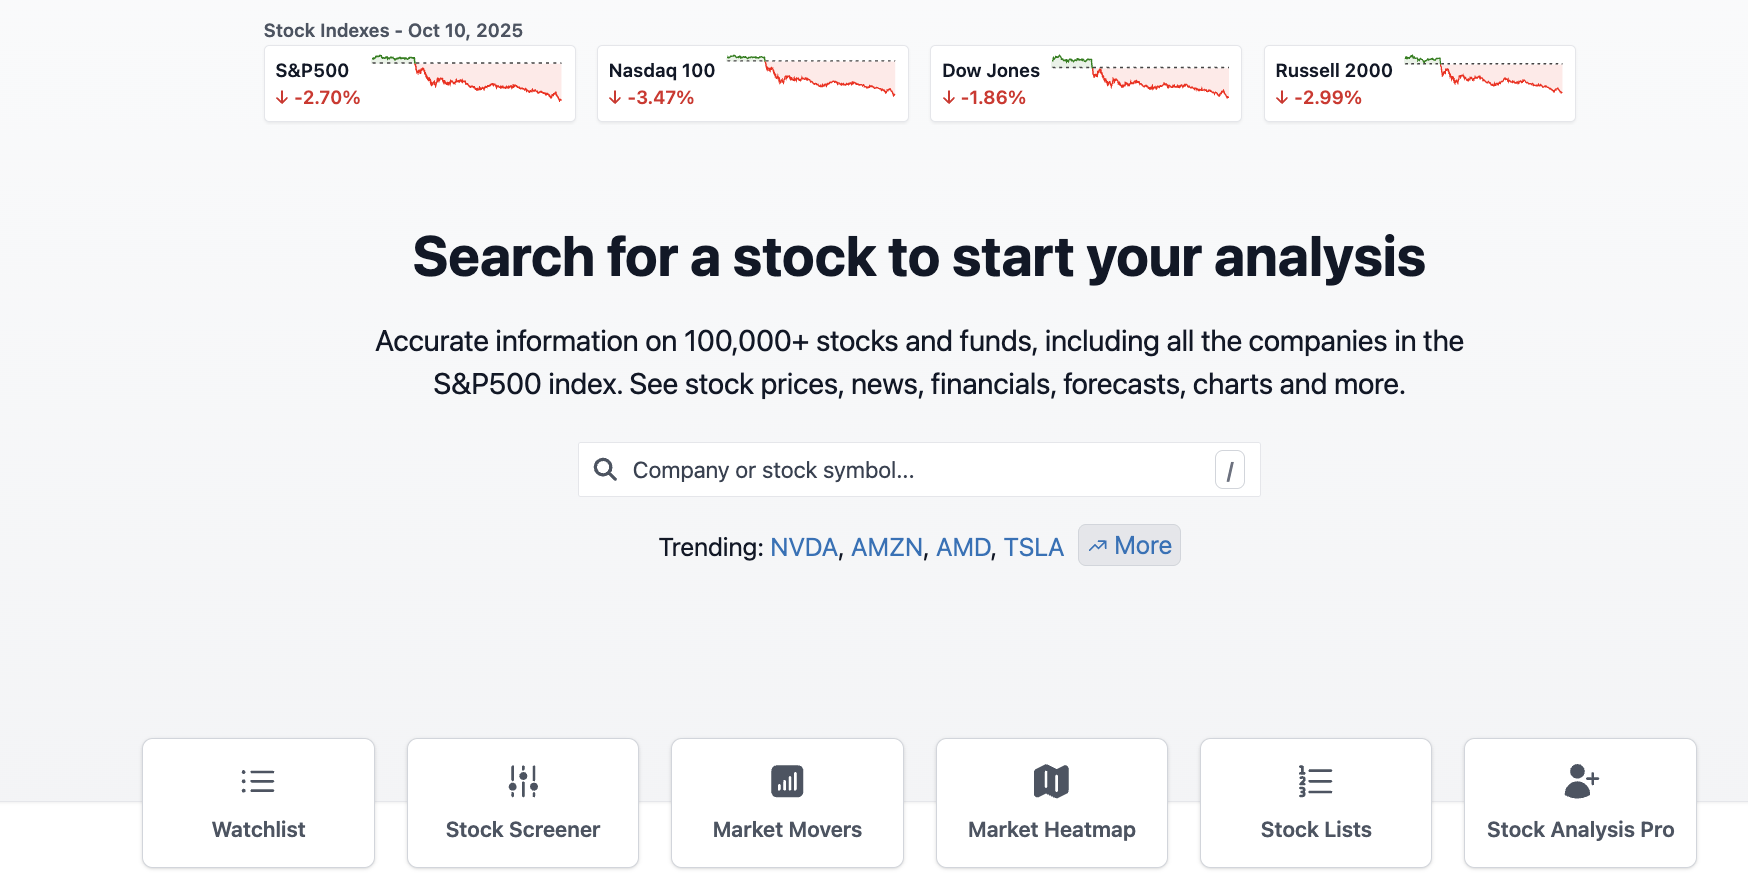
The homepage doesn’t mess around. You have the search bar and tabs to other features, such as a stock screener, watchlist, trending stocks, and market movers.
I typed in “NVDA” and got a dashboard packed with information, but organized in a way that made sense.
I spent most of my time in two sections: the financial statements section (which goes back 40 years if you spring for Pro) and the stock screener.
The stock screener feature deserves a special mention, as most free screeners are either useless or designed to frustrate you into upgrading. This one actually works. Even the mobile experience was smooth, with no missing features.
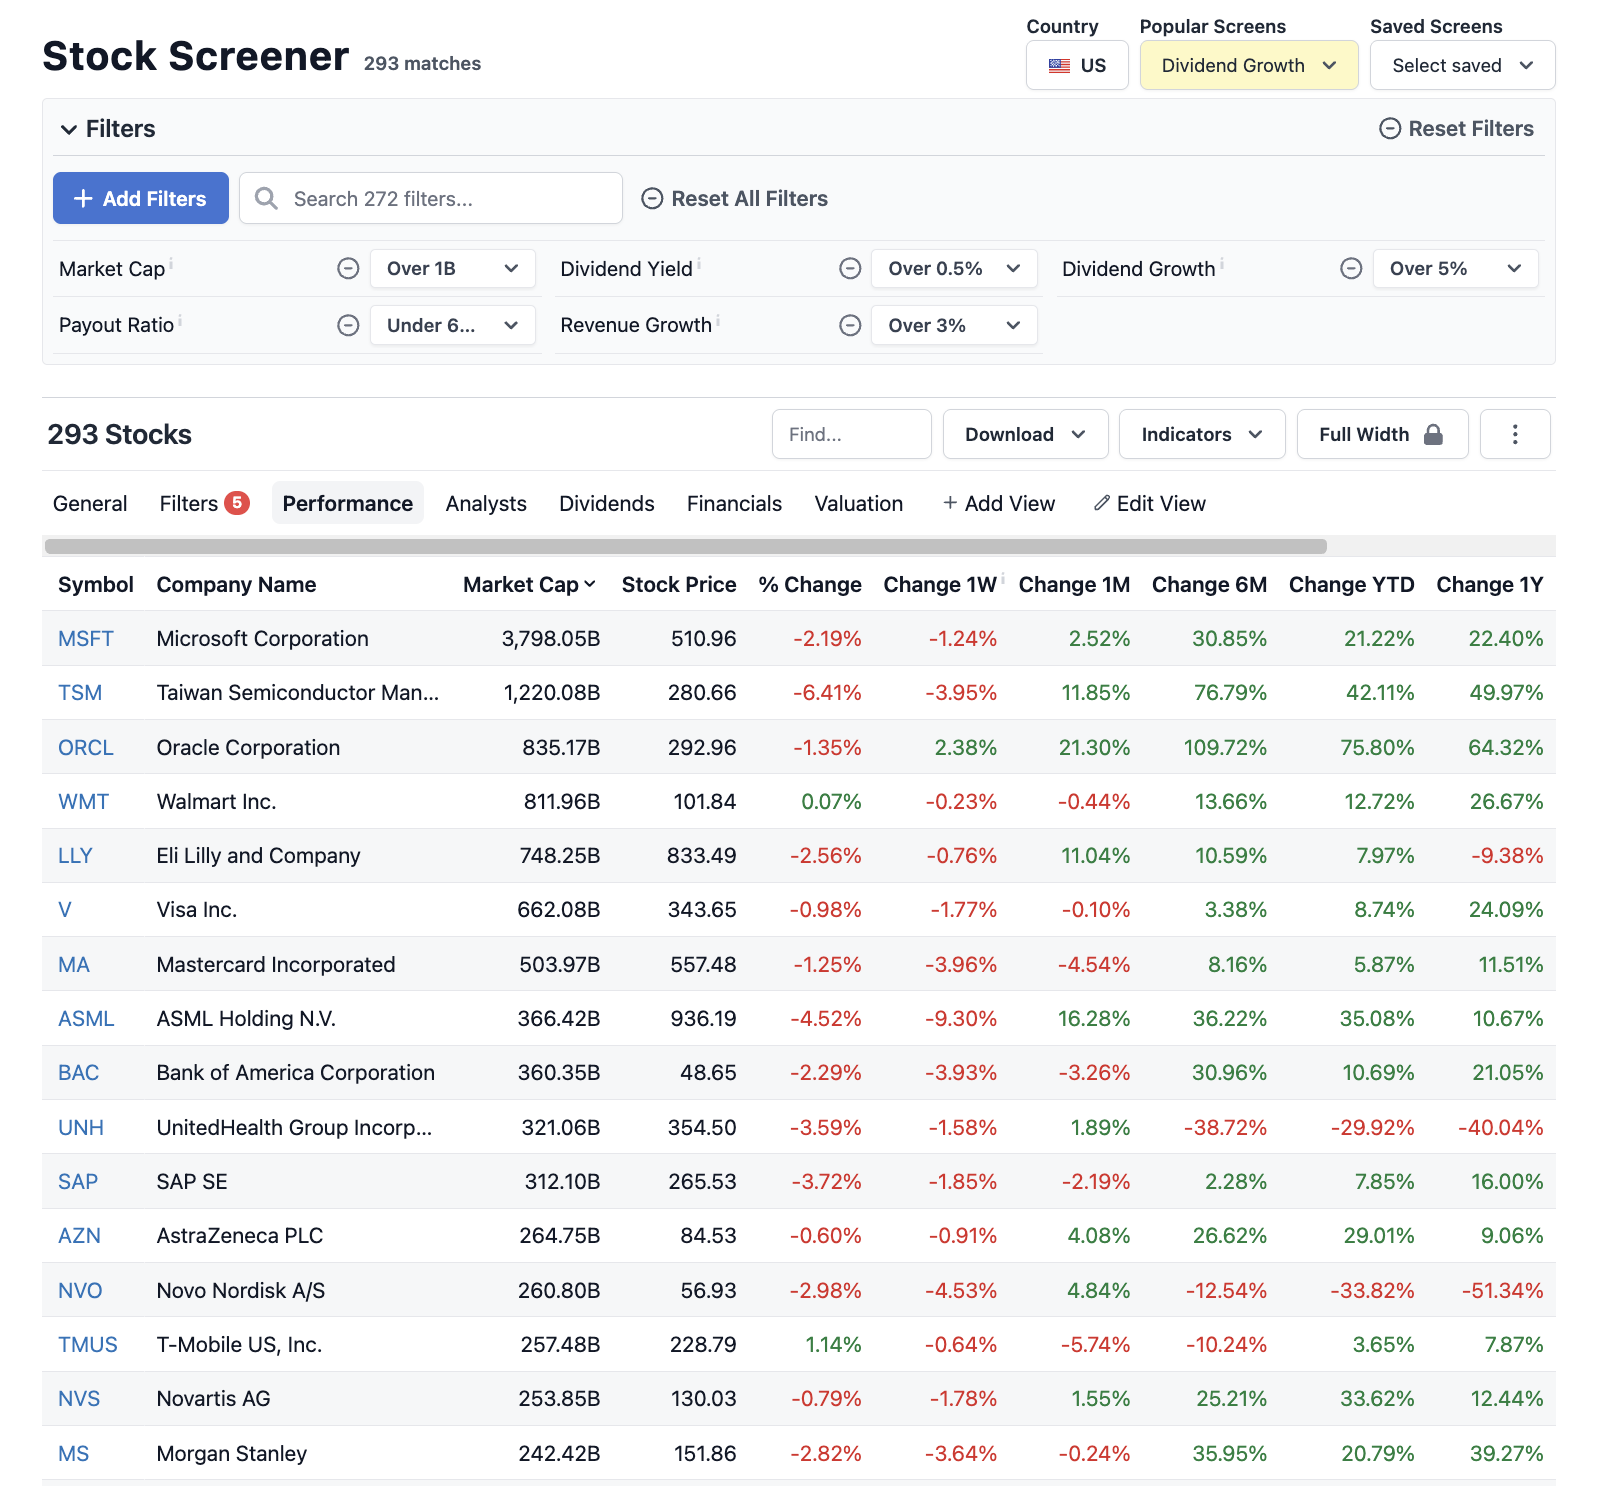
The speed kept bringing me back to the platform. When you’re comparing five tech stocks and need to check their debt-to-equity ratios, those extra seconds matter. You stay in flow instead of waiting for pages to load.
What I Liked
Speed beats everything else here: Pages load in under a second. I’ve used platforms where you click on a stock and then wait for a loading spinner to appear for ten seconds. That disrupts your research flow, causing you to lose your train of thought.
The free tier actually delivers: Most platforms give you enough free access to realize you need the paid version. Stock Analysis provides you with the stock screener and detailed financials, all without requiring a credit card. There are limits on historical data, but it’s more than enough for casual research.
No ads on Pro: I upgraded to Pro partly because the ads on the free version were distracting. Once I was a paid subscriber, the interface became surgical with no banners screaming about crypto or “One Weird Trick” garbage.
Comparing stocks takes seconds: I can line up three companies side-by-side and see their revenue growth, margins, and valuations without opening multiple tabs or building spreadsheets.
They’re upfront about everything: The site tells you where data comes from (S&P Capital IQ, mostly). They mention being a small team, which helps build trust through this transparency.
Where It Fell Short
You get numbers, not stories: The platform shows you a company’s margins improved 5% year-over-year. Great. But why? It could be due to a new product line, cost-cutting initiatives, or accounting manipulation. You’re on your own to figure that out. WallStreetZen can help you out here, with features like the handy “Why Price Moved” feature.
Charts are bare-bones, showing you price movement over time. That’s about it. You need to look elsewhere for Fibonacci retracements or volume-weighted indicators. I’d suggest pairing it with a platform like TradingView.
Zero analyst input: Some investors don’t care what Wall Street thinks. I’m not one of them, and I want to know if Goldman’s top semiconductor analyst is bullish or bearish. Stock Analysis.com reviews from other users echo this complaint, as the platform provides data but lacks interpretation. Once again, WallStreetZen can help, with a Forecast page that lets you see current analyst commentary and sentiment.
Portfolio tracking feels like an afterthought: You can create watchlists and track positions, but don’t expect performance analytics or any sophisticated portfolio management. It’s functional but basic.
No community: You don’t want to hear random internet strangers debate whether Tesla’s overvalued. But sometimes those discussions surface insights you’d miss on your own. Stock Analysis is a solo experience.
How Much It Costs
The Stock Analysis platform has three tiers, each one designed for different commitment levels:
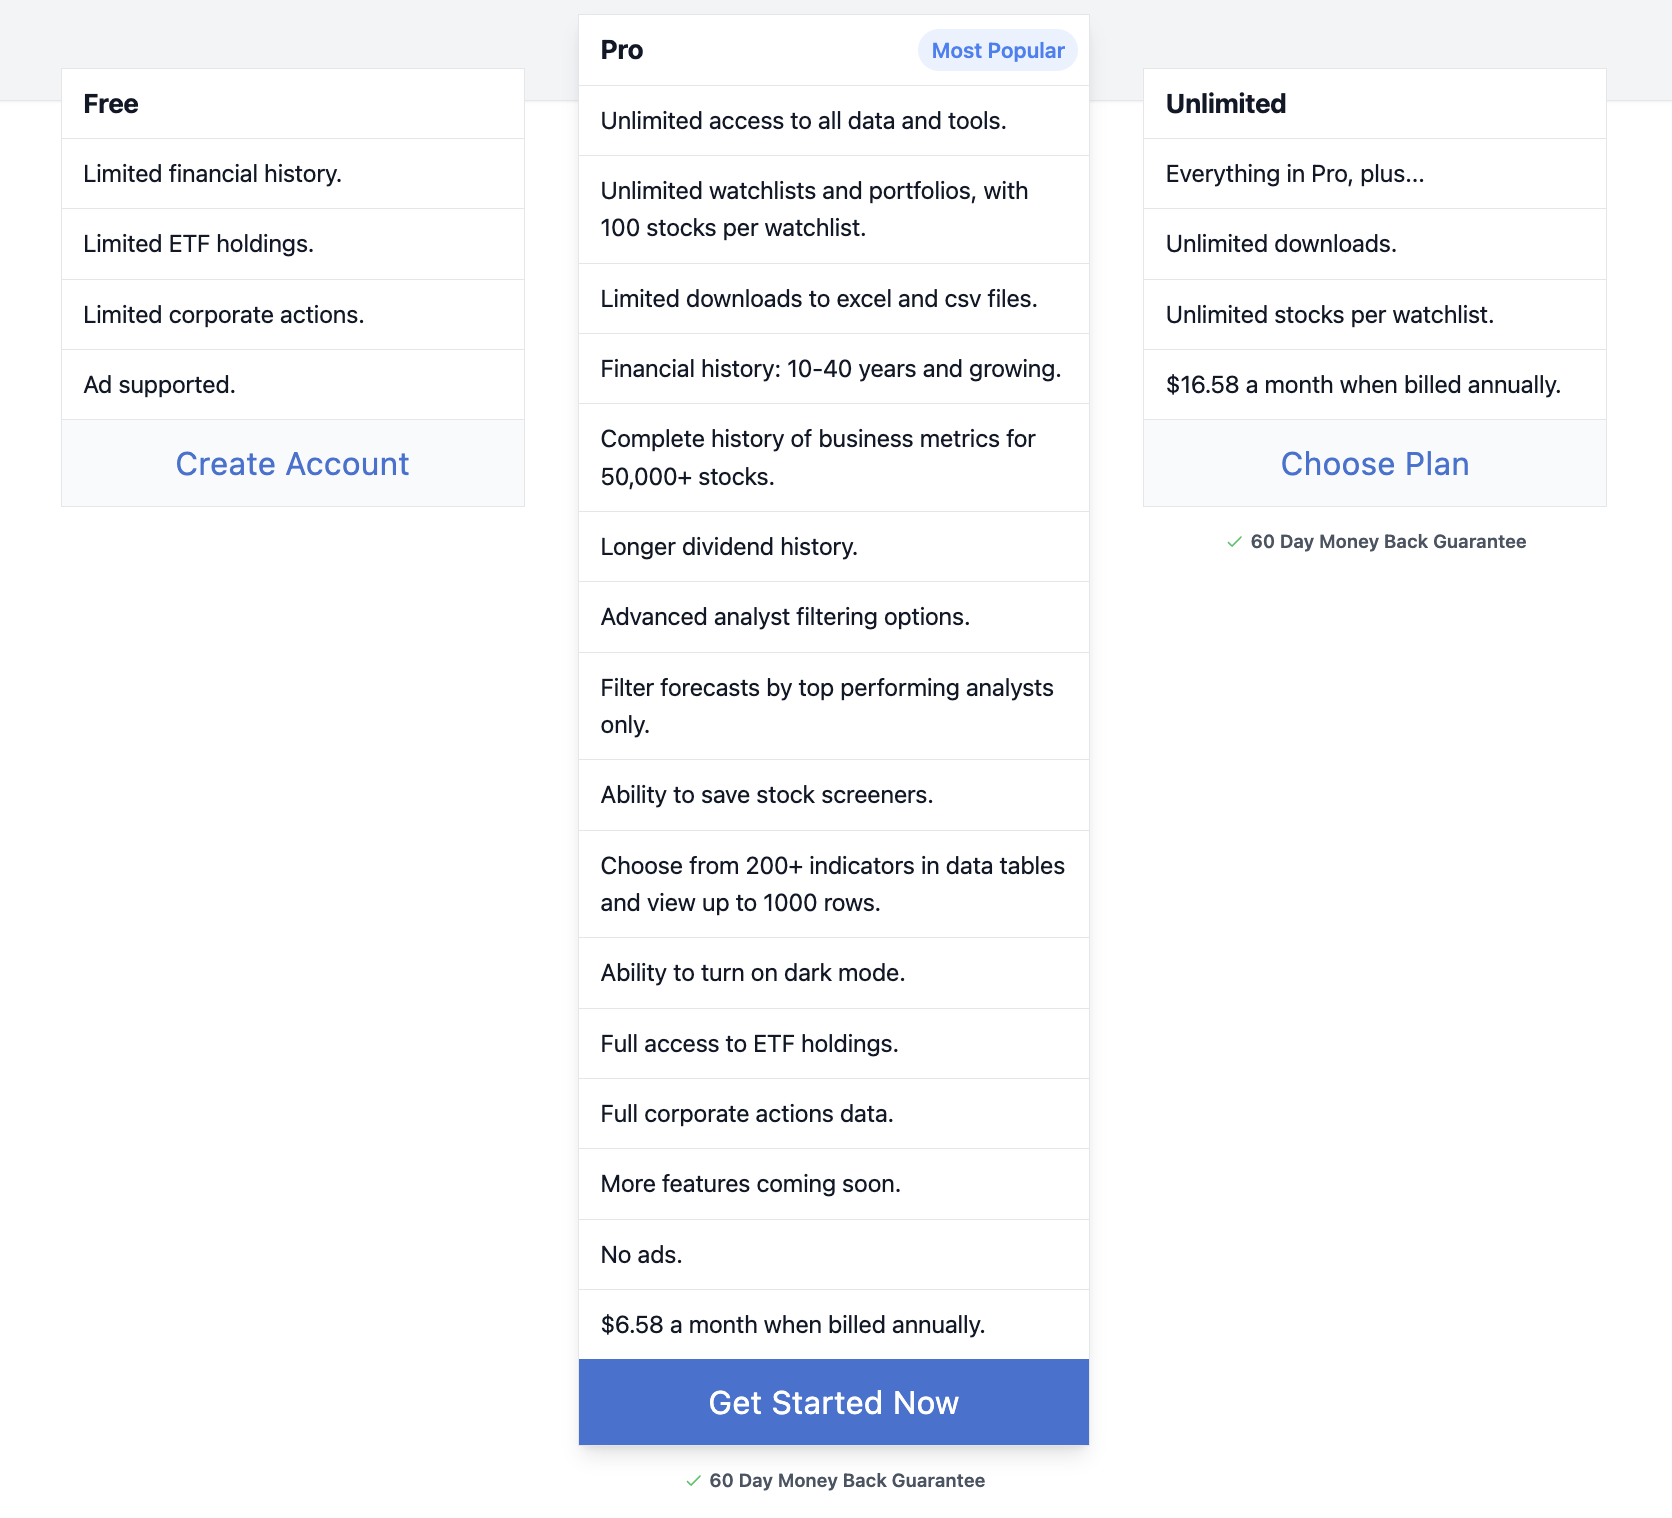
Free Plan (Ad-supported)
- Stock screener access
- Basic financial statements
- Limited historical data
- 15-minute delayed market data
Pro Plan ($9.99/month or $79/year)
- No ads
- 10-40 years of financial history
- Real-time streaming prices
- One data export daily
- Full watchlist features
Unlimited Plan ($199/year)
- Everything in Pro
- Unlimited data exports
- Unlimited stocks per watchlist
Both paid tiers come with a 60-day money-back guarantee, which is generous, given most platforms give you 30 days max.
At $79 annually, Pro costs less than a monthly Netflix subscription. When you compare that to platforms charging $300+, the value proposition looks solid. Whether it’s worth it depends on how much you use it. I found myself on the site almost daily, so the math worked for me.
Who StockAnalysis.com Is Best For
This platform shines for specific types of investors:
You’ll love it if you:
- Want raw data without editorial spin
- Get annoyed by cluttered interfaces and aggressive ads
- Prefer drawing your own conclusions from financial statements
- Need quick lookups and comparisons without feature overload
- Know your way around a balance sheet
Skip it if you:
- Need context and explanations alongside numbers
- Want analyst opinions and research reports
- Look for advanced charting and technical analysis
- Prefer AI-powered insights or automated stock ratings
- Feel lost without guidance on what the data means
The Stock Analysis app review consensus seems clear: experienced investors who trust their own analysis get the most value. Beginners often feel like they’re staring at a spreadsheet without a decoder ring.
Competitors to Consider
Feature | StockAnalysis.com | Seeking Alpha | Simply Wall St | Stock Rover | |
|---|---|---|---|---|---|
Cost (Annual) | Free / $79 (Pro) | Free / $234 (Premium) | Free / $299 (Premium) | Free / $120 (Premium) | Free / $79.99 (Essentials) |
Key Strength | Raw Data & Speed | AI Ratings & Context | Community & Opinions | Visualizations | Portfolio Analysis |
Best For | DIY Data-Miners | Insight-Seeking Investors | Opinion-Driven Traders | Visual Learners | Advanced Power-Users |
1. WallStreetZen
Cost: Free basic access; Premium runs $19.50/month (or $234/year if you pay annually).
What you get: WallStreetZen takes the opposite approach from Stock Analysis. Instead of dumping data on you, it tells you what that data means.
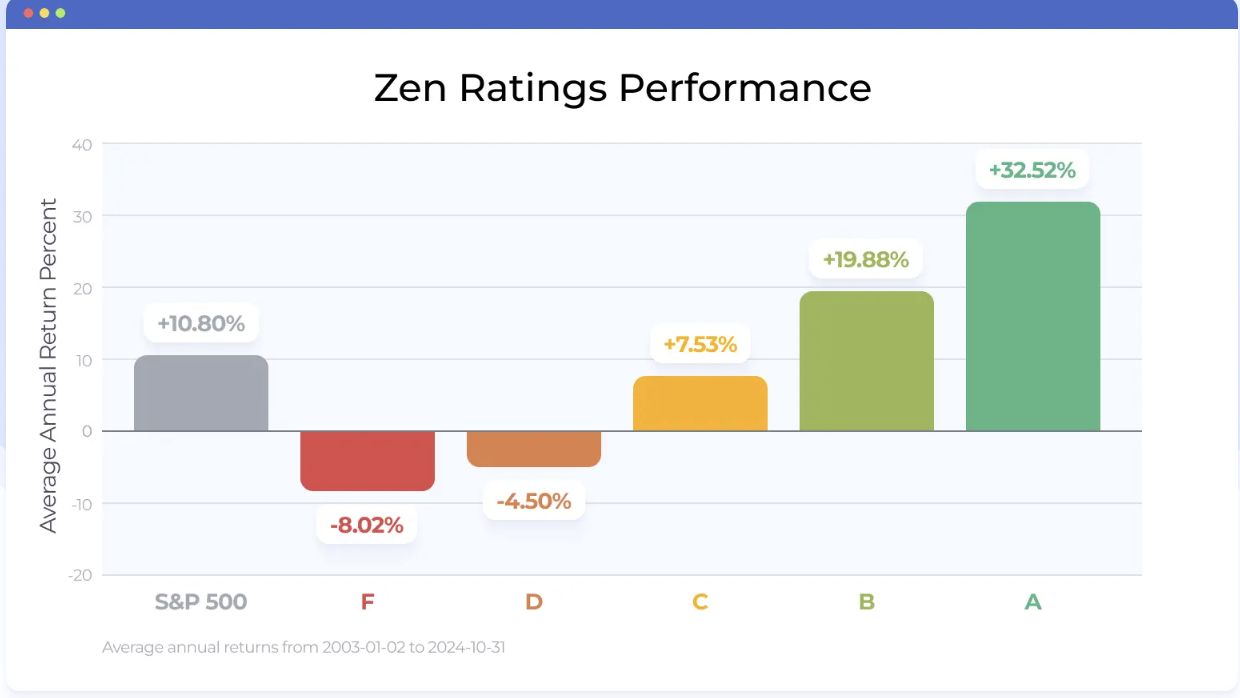
The Zen Ratings system caught my attention first. It analyzes 115 fundamental factors and calculates a simple 1-100 score.
Then there’s the Top Analysts database. WallStreetZen tracks 4,000+ Wall Street analysts and shows you which ones actually know what they’re talking about.
When an analyst with a 75% success rate upgrades a stock, that matters. When a guy with a 40% track record does the same thing? Less so.
But here’s my favorite feature: one-sentence explanations for price movements. Stock up 8% today? WallStreetZen tells you exactly why in plain English — no hunting through press releases or earnings call transcripts.
Who it’s best for: Part-time investors who want insights, not just data. If you’re tired of staring at numbers and wondering what they mean, WallStreetZen connects those dots.
How it compares: Stock Analysis shows you what happened. WallStreetZen explains why it happened. I keep both open when I’m researching. Stock Analysis gives me the raw numbers. WallStreetZen helps me understand if those numbers are good, bad, or misleading.
The interface feels more beginner-friendly, too. You won’t drown in data like you might on pure data platforms. The Zen Ratings system alone saves hours of manual analysis. You can still dig into the details, but you get a clear starting point instead of a blank spreadsheet.
BONUS: Zen Investor
WallStreetZen offers a complementary service called Zen Investor, which might interest you. Steve Reitmeister, who’s been analyzing stocks for 44 years, picks specific stocks and tells you when to buy and sell them.
These are actual stock recommendations with the reasoning spelled out. If you’d rather follow an expert’s strategy than build your own, Zen Investor delivers that. Think of it as the guided tour versus the self-guided research approach. Get started here.
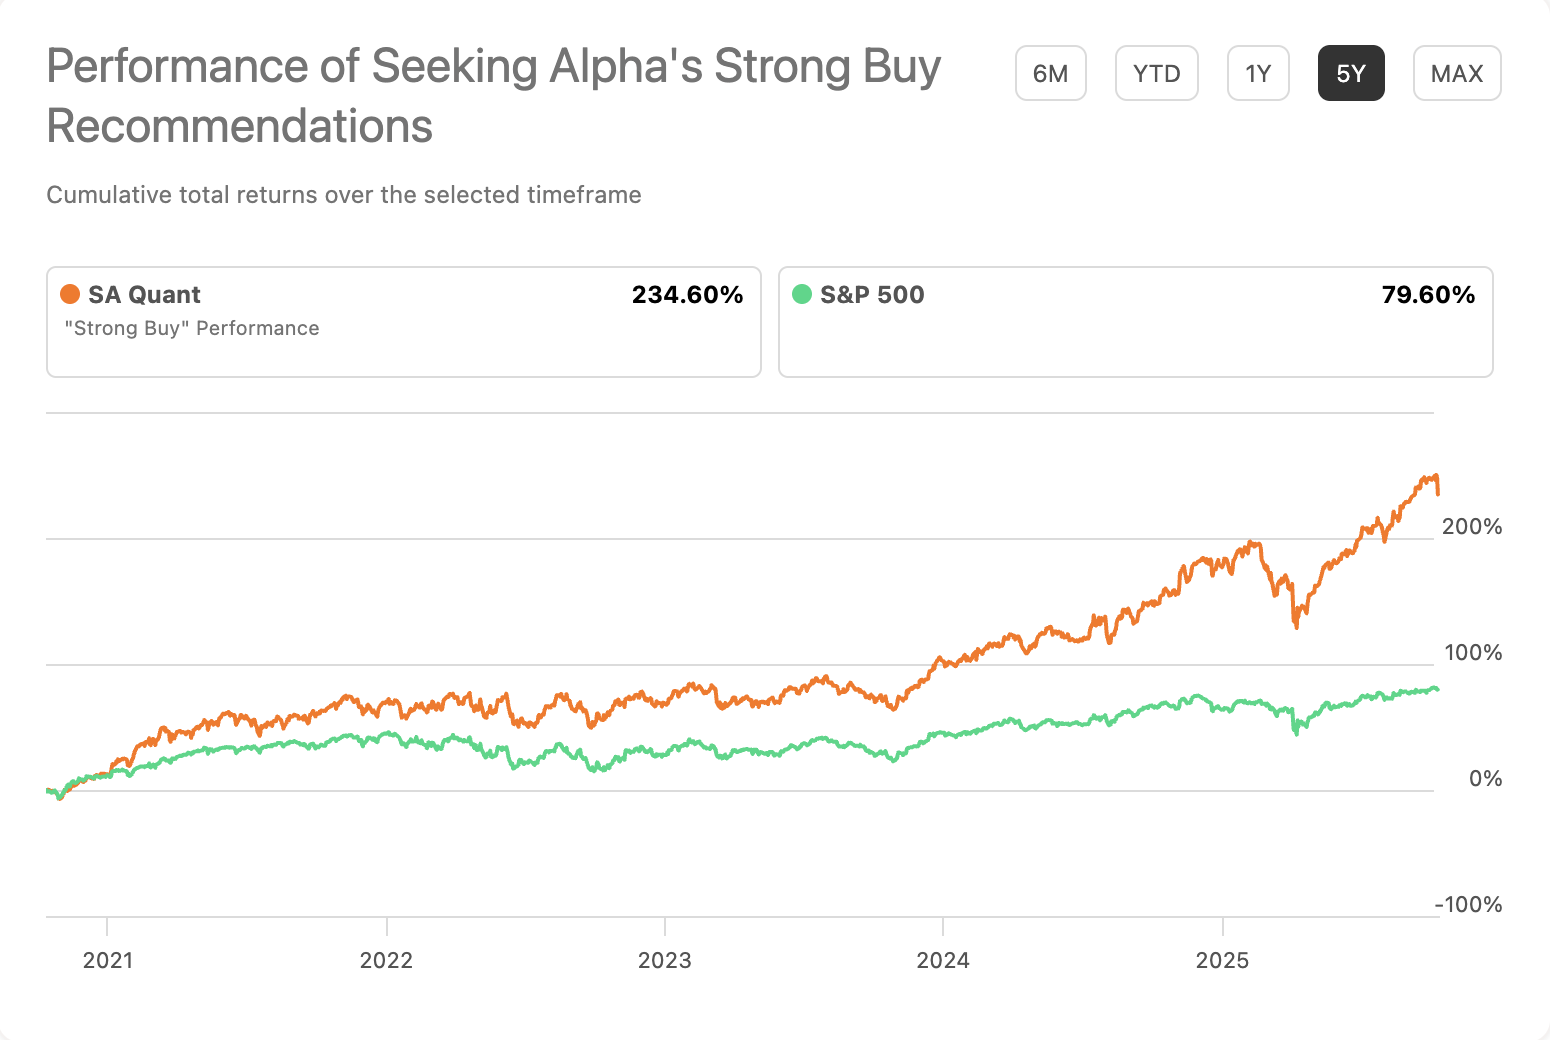
2. Seeking Alpha
Cost: Free basic access; Premium costs around $299/year; Pro jumps to $2,400/year.
What you get: Seeking Alpha is chaos organized into a website. Thousands of contributors, ranging from bloggers to hedge fund managers, post articles discussing stocks.
You’ll find Quant Ratings, breaking news, financial data, and more opinions than you can process.
Who it’s best for: Investors who want to see every angle on a stock. If you like hearing the bull case and bear case before deciding, Seeking Alpha delivers both (and about seven variations of each).
How it compares: Where Stock Analysis feels like a quiet library, Seeking Alpha feels like a stock market debate club. The interface is cluttered, and information comes at you from every direction. But that crowd-sourced approach surfaces insights you won’t find elsewhere.
I use Seeking Alpha to gauge sentiment and find contrarian viewpoints. If everyone’s bullish on a stock, reading the bearish articles helps me spot risks I might’ve missed.
Beyond data, you get community commentary, premium analysis, and deep-dive reports. It’s not nearly as clean or fast as Stock Analysis; in fact, it can feel cluttered. But if you want to know what thousands of other investors are saying about a stock, it’s the place.
3. Simply Wall St
Cost: The free plan provides five reports each month, while the Premium plan costs approximately $120/year for 30 monthly reports.
What you get: Simply Wall St turns financial data into gorgeous infographics. The stock visualization summarizes a company’s valuation, growth prospects, financial health, and dividends in one graphic. It’s like Instagram for stock analysis.
Who it’s best for: Visual learners who find spreadsheets intimidating. If you learn better from charts and diagrams than rows of numbers, this platform clicks.
How it compares: Stock Analysis appeals to spreadsheet users, while Simply Wall St appeals to visual users. The reports look amazing and make complex concepts accessible. But once you want deeper data, you hit walls. The pretty graphics can only take you so far.
I’ll admit the visuals drew me in at first. The stock charts give you a quick health check on a company. But when I needed to dig into specific line items or compare historical trends, I went back to platforms with more data depth.
4. Stock Rover
Cost: Free tier available; Essentials costs $79.99/year; Premium runs $179.99/year; Premium Plus hits $279.99/year.
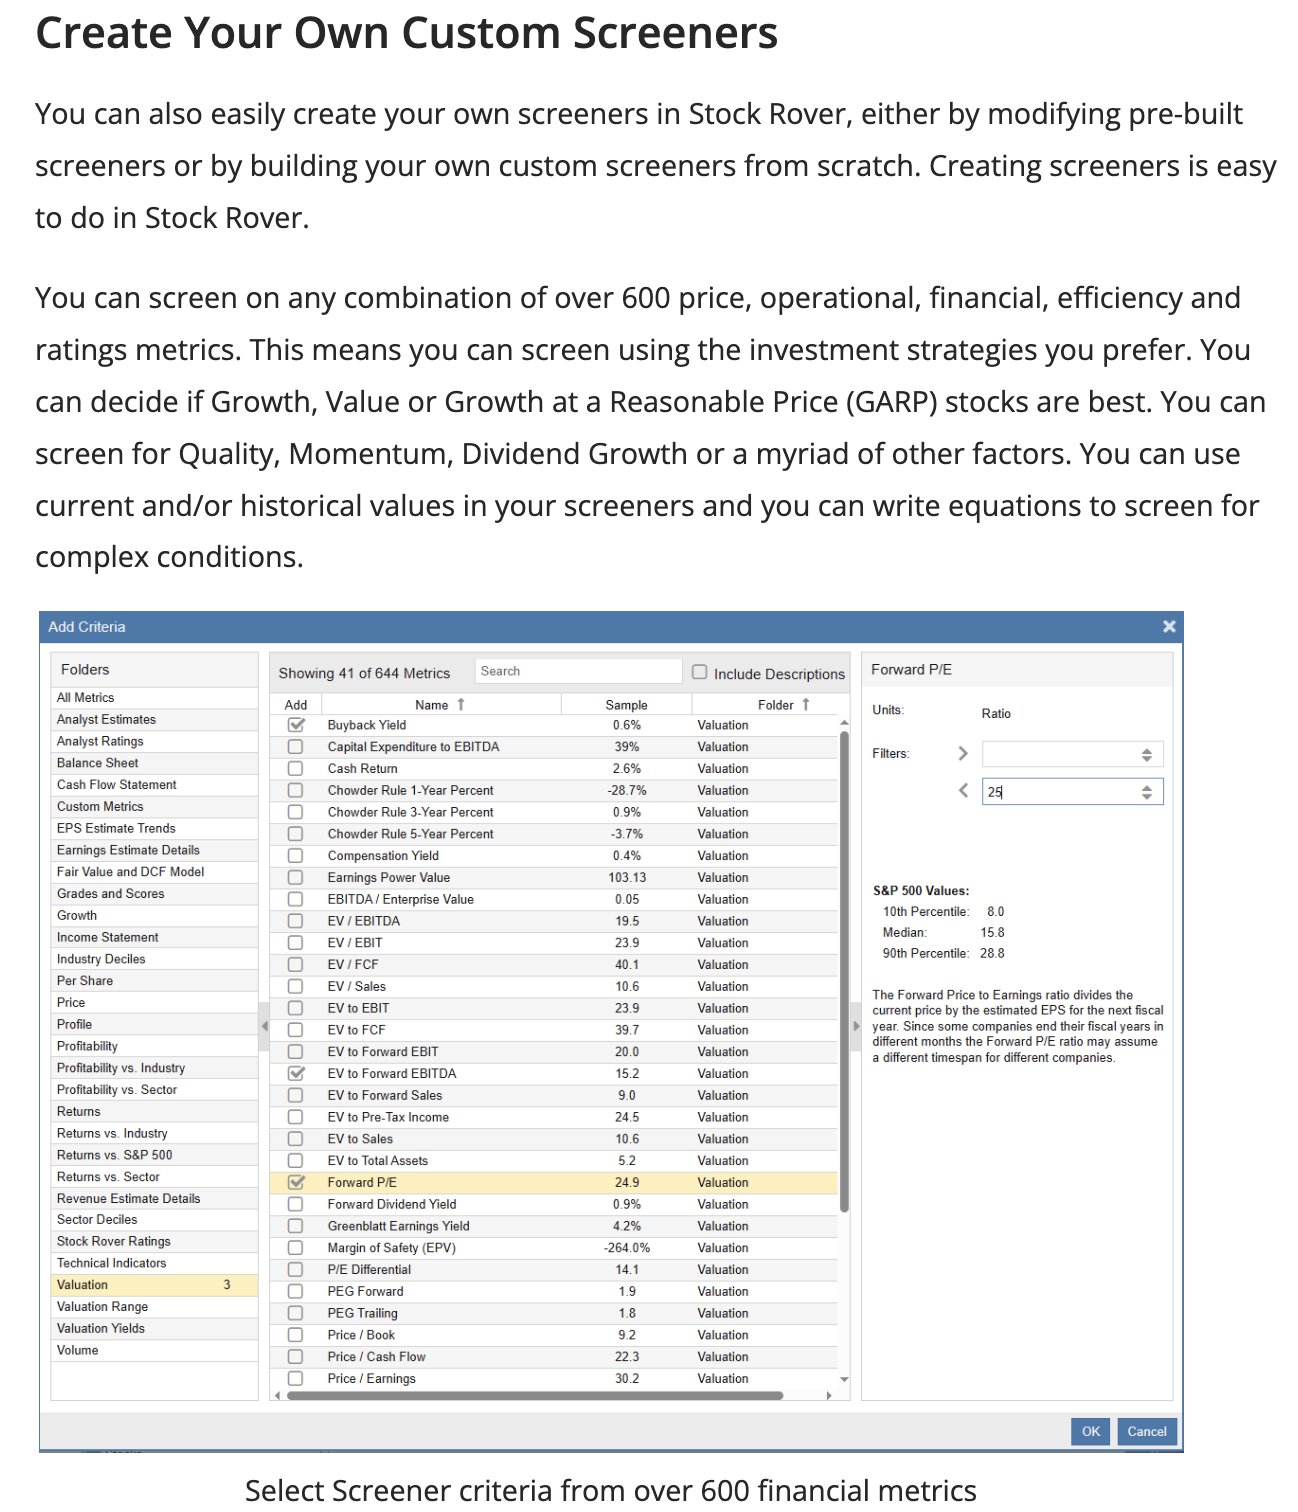
What you get: Stock Rover is the power user’s dream, armed with hundreds of screening metrics such as advanced portfolio tracking, performance attribution, and research reports that rival what you’d pay a financial advisor for.
Who it’s best for: Serious investors managing multiple portfolios who want professional-grade tools. If you’re tracking dozens of positions and need sophisticated analysis, Stock Rover delivers.
How it compares: Stock Rover is the industrial-strength workstation compared to Stock Analysis’s sleek laptop. You can do more, but the learning curve is steeper. It’s less about quick lookups, more about comprehensive ongoing analysis.
I tried Stock Rover for a month, but I felt overwhelmed. There’s so much functionality that I spent more time learning the platform than researching stocks. If you need that power, great. If you just want to check some fundamentals before buying a stock, it’s overkill.
Verdict: My Honest Take
After weeks of actual research using StockAnalysis.com, my gut reaction proved accurate: it’s a brilliant tool for a specific investor.
Do you want to cut through the noise and get straight to the numbers? Outstanding. The website speed alone earns it a permanent bookmark in my browser. I still use it for quick data checks even when I’ve got other platforms open.
But here’s the catch.
The platform’s biggest strength, raw data without interpretation, is also its biggest weakness.
That’s where I pair it with WallStreetZen. Stock Analysis gives me the “what.” WallStreetZen explains the “why.”
The combination covers everything I need: quick data lookups from Stock Analysis, then context and analysis from WallStreetZen’s Zen Ratings and analyst insights.
If you’re a data-driven investor who likes drawing your own conclusions, try the free version. See if the interface clicks for you. The Pro plan at $79/year is reasonable if you end up using it regularly.
Just know what you’re getting: exceptional data delivery with zero hand-holding. For some investors, that’s perfect. For others, it’s a dealbreaker.
FAQs:
Is StockAnalysis free?
Yes. StockAnalysis.com has a free version supported by ads. You get the stock screener and basic financial statements without signing up.
The Pro plan costs $79/year, eliminating ads and unlocking 10-40 years of financial history, real-time prices, and data exports.
Heavy users can grab the Unlimited plan at $199/year for unlimited downloads.
Is StockAnalysis legit?
Absolutely. StockAnalysis.com is legitimate. They source data from reputable providers like S&P Capital IQ and have been around since 2019, with thousands of users.
They're transparent about where their data comes from and who runs the platform.
Is StockAnalysis.com reliable?
Yes, the platform's reliable for financial data. They run automated and manual quality checks on their information. They're upfront when there are known issues or limitations.
That said, verify critical information from multiple sources before making any investment decisions; that's just good practice regardless of platform.
How does StockAnalysis compare to WallStreetZen?
StockAnalysis.com excels at raw, quantitative data in clean, spreadsheet-style layouts. It is ideal for investors who want to analyze numbers themselves.
WallStreetZen focuses on context and interpretation. The Zen Ratings system scores stocks on 115 factors, tracks top analysts, and gives you one-sentence explanations for price movements.
I use both because they complement each other.
What’s better for beginners — StockAnalysis or Simply Wall St?
For absolute beginners who think visually, Simply Wall St wins. The infographic-style reports make complex data digestible and less scary. But if you're a beginner looking to learn real financial analysis in a clean environment, StockAnalysis.com is an excellent option.
WallStreetZen is better for gaining context and qualitative insights as it offers AI-powered Zen Ratings that score stocks on 115 factors, tracks top analyst recommendations, and provides one-sentence explanations for price movements.
Where to Invest $1,000 Right Now?
Did you know that stocks rated as "Buy" by the Top Analysts in WallStreetZen's database beat the S&P500 by 98.4% last year?
Our March report reveals the 3 "Strong Buy" stocks that market-beating analysts predict will outperform over the next year.