Jessie Moore has been writing professionally for nearly two decades; for the past seven years, she's focused on writing, ghostwriting, and editing in the finance space. She is a Today Show and Publisher's Weekly-featured author who has written or ghostwritten 10+ books on a wide variety of topics, ranging from day trading to unicorns to plant care.
What’s the Best Quantitative Analysis Trading Tool in 2025?
To write this post, I tested dozens of quantitative analysis tools. I’ve narrowed it down to the best 7 — the best option on the list depends on your objectives. For instance, if you want accessible ratings, go with Zen Ratings — if you want sophisticated backtesting capabilities and a tech-y edge for short-term trading, you might like TrendSpider.
But seriously — there’s an option for everyone.
That’s why, in this comprehensive guide, I’ll walk you through the seven best quantitative analysis tools and apps available today. We’ll explore what each platform offers, who it’s best suited for, its costs, and how it can enhance your quantitative trading strategies.
From advanced backtesting engines and AI-driven insights to powerful screeners built on quantitative factors, I’ll tell you all about resources that can help you analyze markets with mathematical precision and elevate your trading performance. I’ll also explain what quant trading is — scroll below the list if you want to find out right away.
The Best Quant Trading Apps in 2025: AI, Backtesting, & More
1. Zen Ratings
- Overall Rating: 4.8/5
- Cost: Free (Basic Ratings); Full access with WallStreetZen Premium ($19.50/month billed annually)
- Best for: Fundamental investors seeking data-driven stock selection; suitable for various investment styles due to component grades; users who value AI-driven insights
What it is
Zen Ratings represents the pinnacle of accessible quantitative analysis for individual investors. This proprietary stock rating system from WallStreetZen analyzes over 4,600 US-listed stocks daily, evaluating each across 115 distinct quantitative factors.
The system covers crucial dimensions including growth potential, valuation metrics, financial health, momentum indicators, dividend characteristics, and exclusive AI-driven predictive factors.
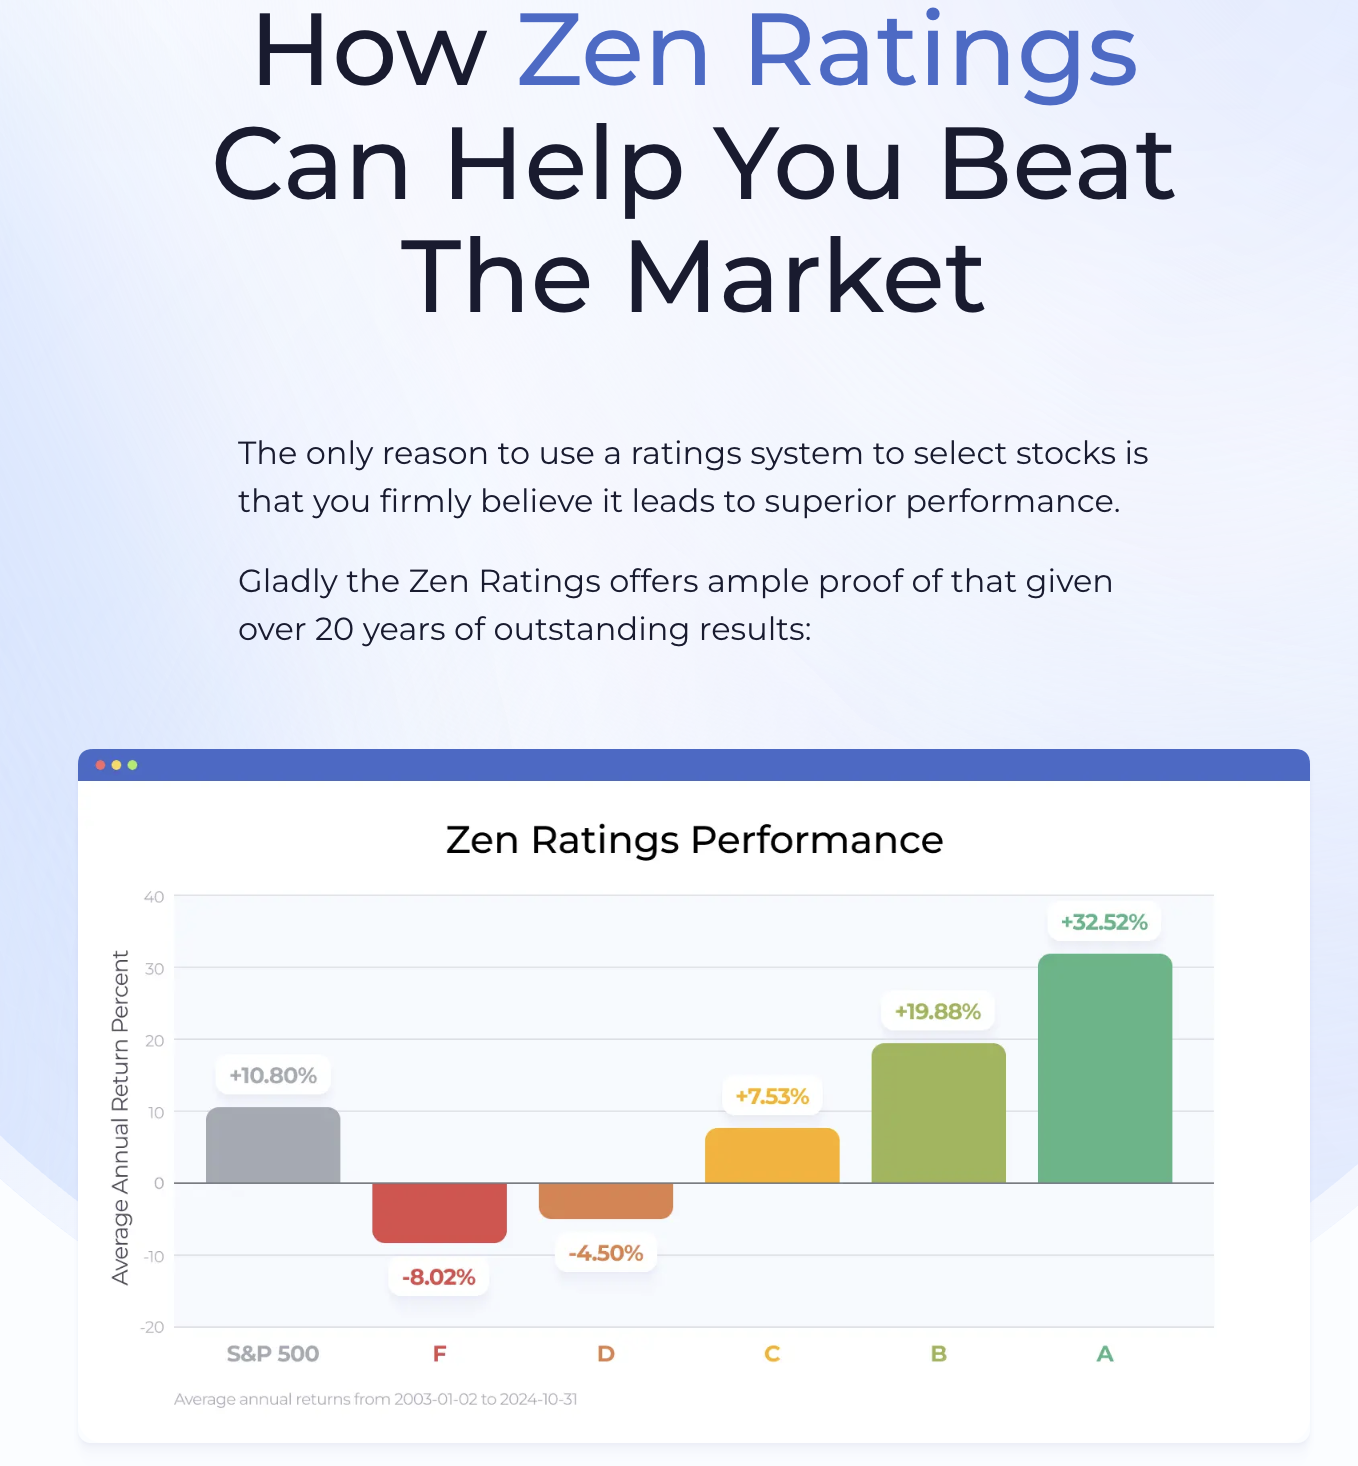
The magic of Zen Ratings lies in its ability to distill complex quantitative analysis into an easy-to-understand letter grade from A (Strong Buy) to F (Strong Sell). Since 2003, stocks rated ‘A’ have delivered an impressive average annual return of +32.52%, significantly outperforming the S&P 500.
How it empowers Quantitative Analysis
Zen Ratings is essentially quantitative finance made accessible. Instead of manually gathering data for 115 factors and building complex models yourself, the robust platform does all the heavy lifting for you.
In addition to an overall score, users also get seven distinct Component Grades: Valuation, Financials, Forecast, Performance, Dividends, Industry, and AI.
The AI component utilizes a Neural Network model trained on over two decades of market data to detect subtle patterns that human analysis might miss, providing a forward-looking quantitative edge for your quantitative trading strategies.
What you get with membership (WallStreetZen Premium)
While basic Zen Ratings are free, unlocking the full power of these quantitative analysis tools requires WallStreetZen Premium:
- Complete list of “A” rated stocks with advanced filtering
- Screen by specific Component Grades and financial metrics
- Daily rating upgrades/downgrades alerts
- Industry rankings to identify top-rated stocks across sectors
- Access to top analyst ratings and premium features
Zen Ratings provides powerful yet intuitive quantitative analysis. It translates complex data into actionable insights and is backed with impressive historical performance.
2. TrendSpider
- Overall Rating: 4.5/5
- Cost: Standard: $52.38-$82/mo; Premium: $61.88-$116.45/mo; Enhanced: $82.96-$155.55/mo (Annual discounts available, 14-day trial)
- Best for: Active traders, technical analysts, and quantitative traders needing sophisticated charting, automated analysis, backtesting, and strategy development
What it is
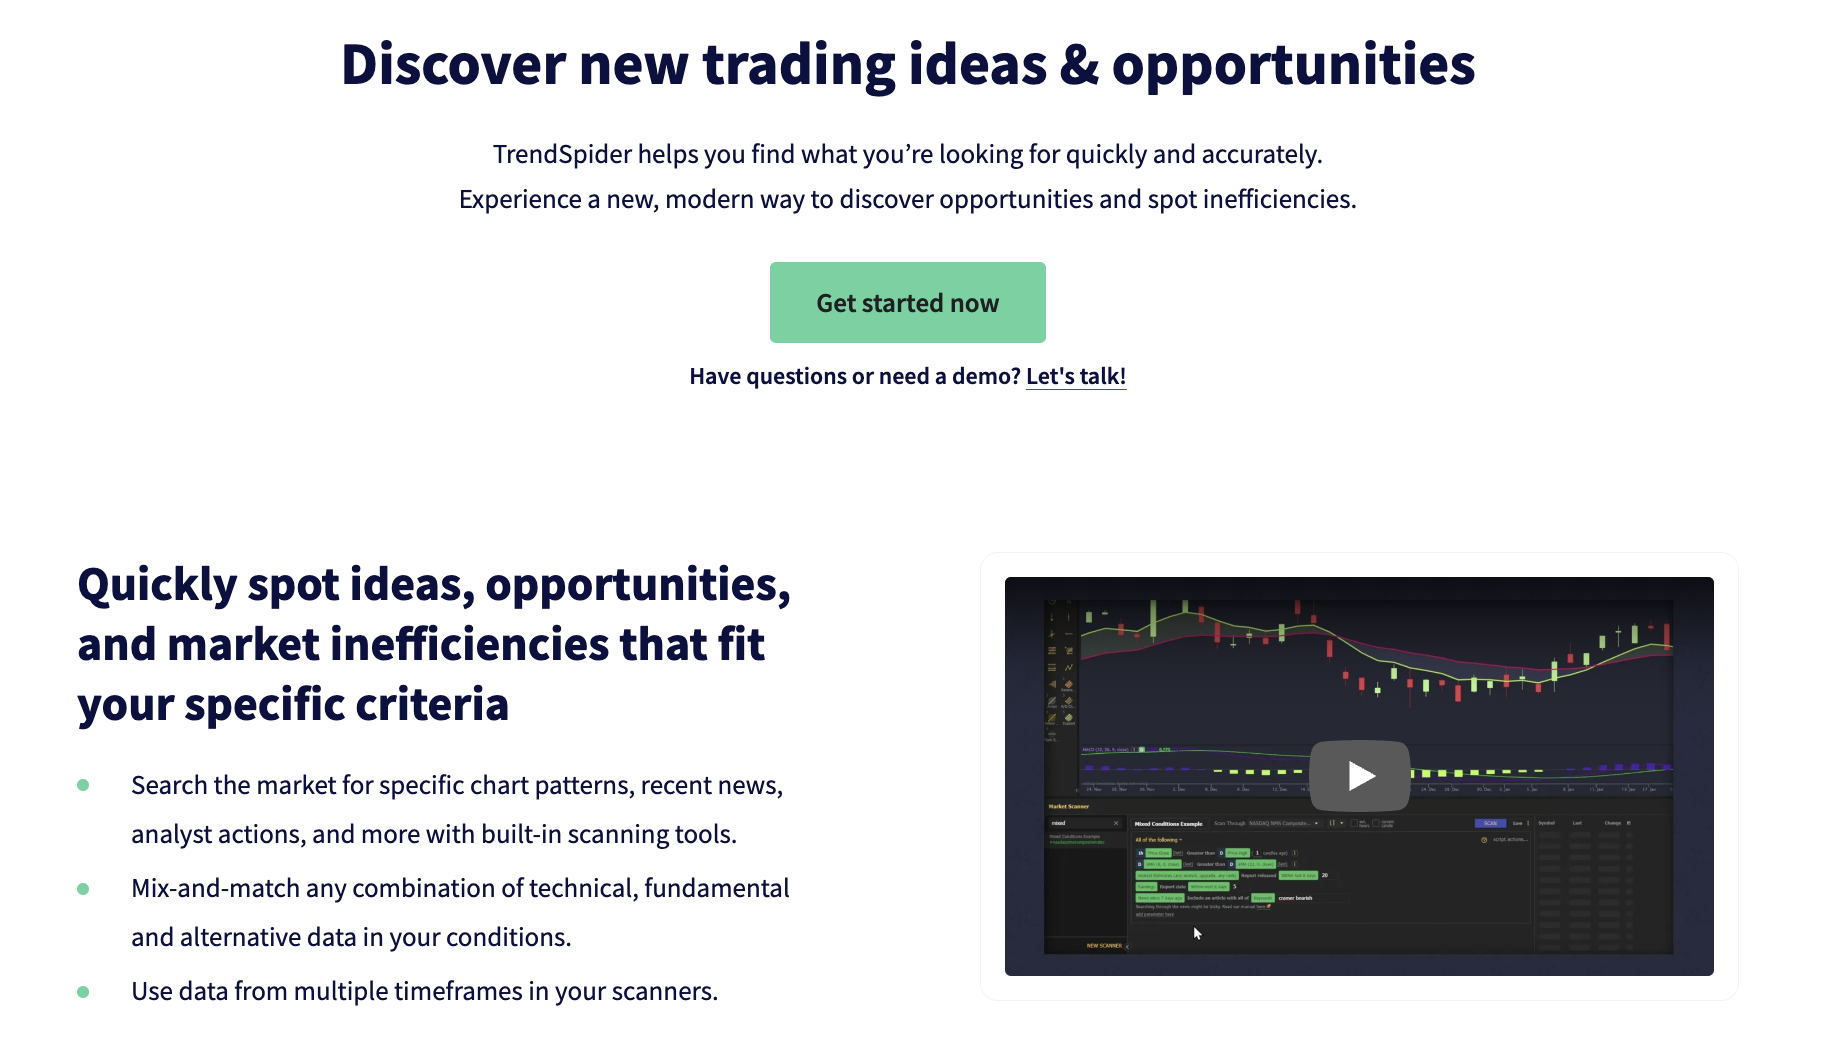
TrendSpider positions itself as an all-in-one technical analysis powerhouse. It’s not just a charting platform but a comprehensive toolkit that automates significant portions of technical analysis while providing sophisticated backtesting capabilities.
Covering stocks, ETFs, crypto, forex, and futures, TrendSpider integrates real-time data with patented automation tools and AI-driven capabilities.
How it empowers Quantitative Analysis
TrendSpider excels in supporting systematic, data-driven trading through several key features that make it one of the premier quantitative analysis tools:
- Automated Technical Analysis: Algorithm-based pattern detection, trendline drawing, and level identification
- Strategy Backtesting Engine: Build and test quantitative trading strategies using visual interfaces or JavaScript against decades of historical data
- AI Strategy Development: Incorporates machine learning models like K-Nearest Neighbors to predict market behavior and train custom AI models for AI quantitative trading
- Advanced Scanning & Alerts: Create complex, multi-factor scans based on technical, fundamental, and alternative data
- Comprehensive Data Integration: Combines technical analysis with fundamentals and economic data for multi-faceted quantitative analysis
What you get with membership
Subscription tiers differ in data depth, speed, and resource limits:
- Higher tiers offer lower latency data and deeper historical access
- Enhanced backtesting capabilities on shorter timeframes
- More active workspaces, alerts, and scanning processes
- Priority support and personalized training
For serious development of quantitative trading strategies, testing, and automation, TrendSpider provides a robust, integrated environment specifically designed for systematic trading.
3. Motley Fool Epic
- Overall Rating: 4.⅖
- Cost: $499/year (First-year discounts often available, e.g., $299)
- Best for: Long-term investors with larger portfolios ($50k+) seeking diversified stock recommendations combined with quantitative research tools
What it is
Motley Fool Epic bundles several popular investment newsletters (Stock Advisor, Rule Breakers, Hidden Gems, and Dividend Investor) into a comprehensive subscription.
While known for its fundamental analysis, Epic incorporates quantitative elements to support data-driven investment decisions. It aims to bridge the gap between traditional research and modern quantitative finance approaches.
How it empowers Quantitative Analysis
Epic integrates several quantitative features alongside qualitative research, making it valuable among quantitative analysis tools for long-term investors:
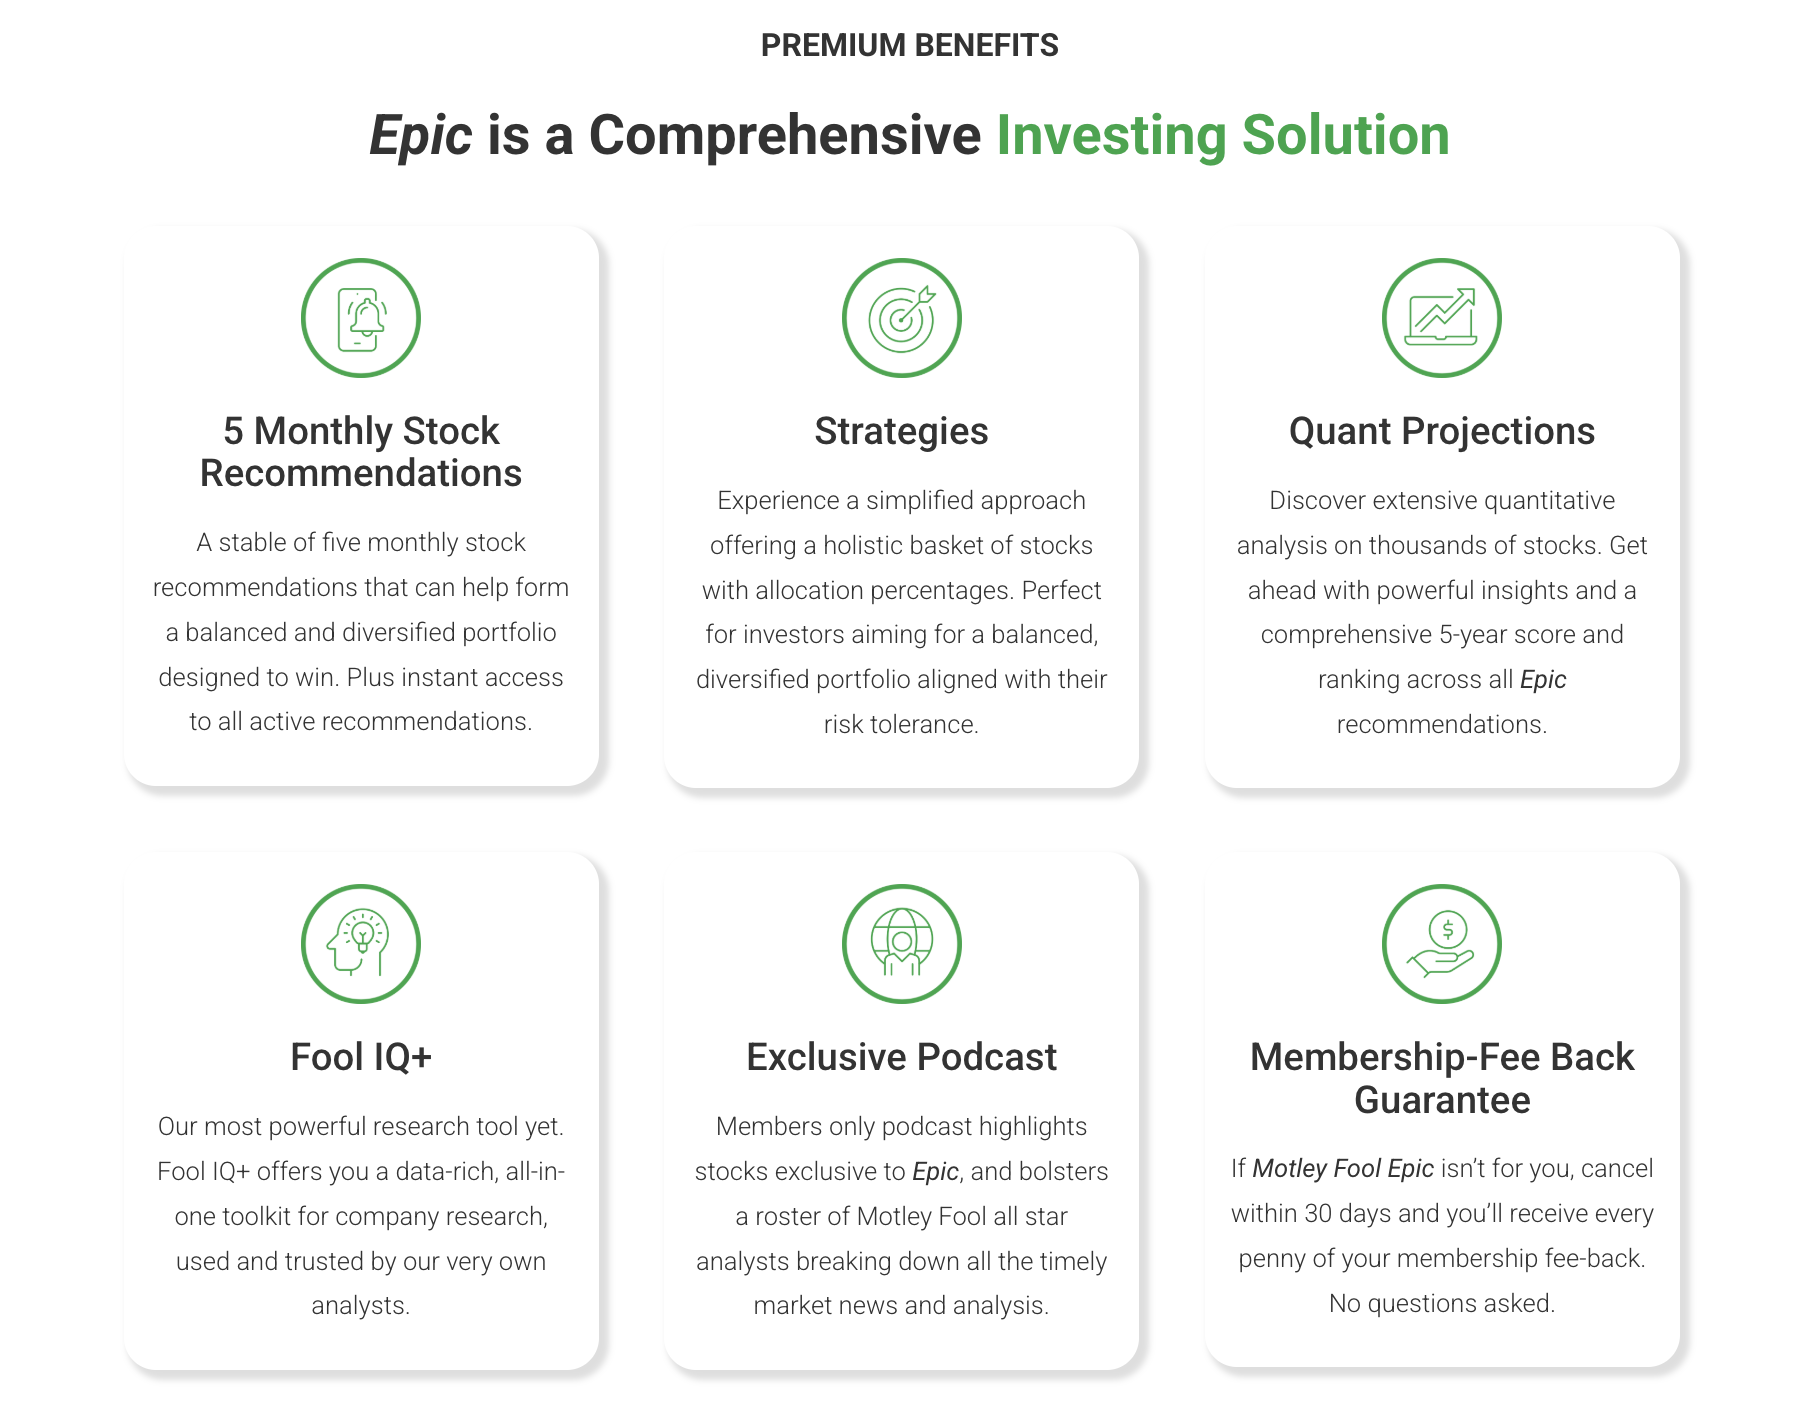
- Motley Fool Quant Score: Proprietary scoring system developed by their internal quantitative team
- FoolIQ+ Research Tools: Access to extensive historical financial data, projected annualized returns, and maximum drawdown information
- Portfolio Allocation Strategies: Model portfolios based on quantitative risk/return optimization techniques rooted in quantitative finance principles
- Simulators: Tools for modeling portfolio performance and testing strategies
What you get with membership
Beyond monthly stock picks from four newsletters, Epic includes:
- Motley Fool Quant 5Y scoring system access
- FoolIQ+ toolkit with historical data and projections
- Portfolio allocation guidance (Cautious, Moderate, Aggressive models)
- GamePlan+ financial planning hub
- Premium podcast and community forums
While focused on fundamental stock picking, Motley Fool Epic integrates proprietary quantitative analysis scores and data tools for investors who appreciate both qualitative insights and data-driven metrics.
4. Finviz
- Overall Rating: Free: 4.5/5; Elite: 4.0/5
- Cost: Free (Robust features); Elite: $39.50/month or $299.50/year
- Best for: Free: All investors needing powerful stock screening; Elite: Active traders requiring real-time data, backtesting, and advanced analysis
What it is
Finviz is renowned for its incredibly powerful stock screener. It is arguably one of the best free quantitative analysis tools available.
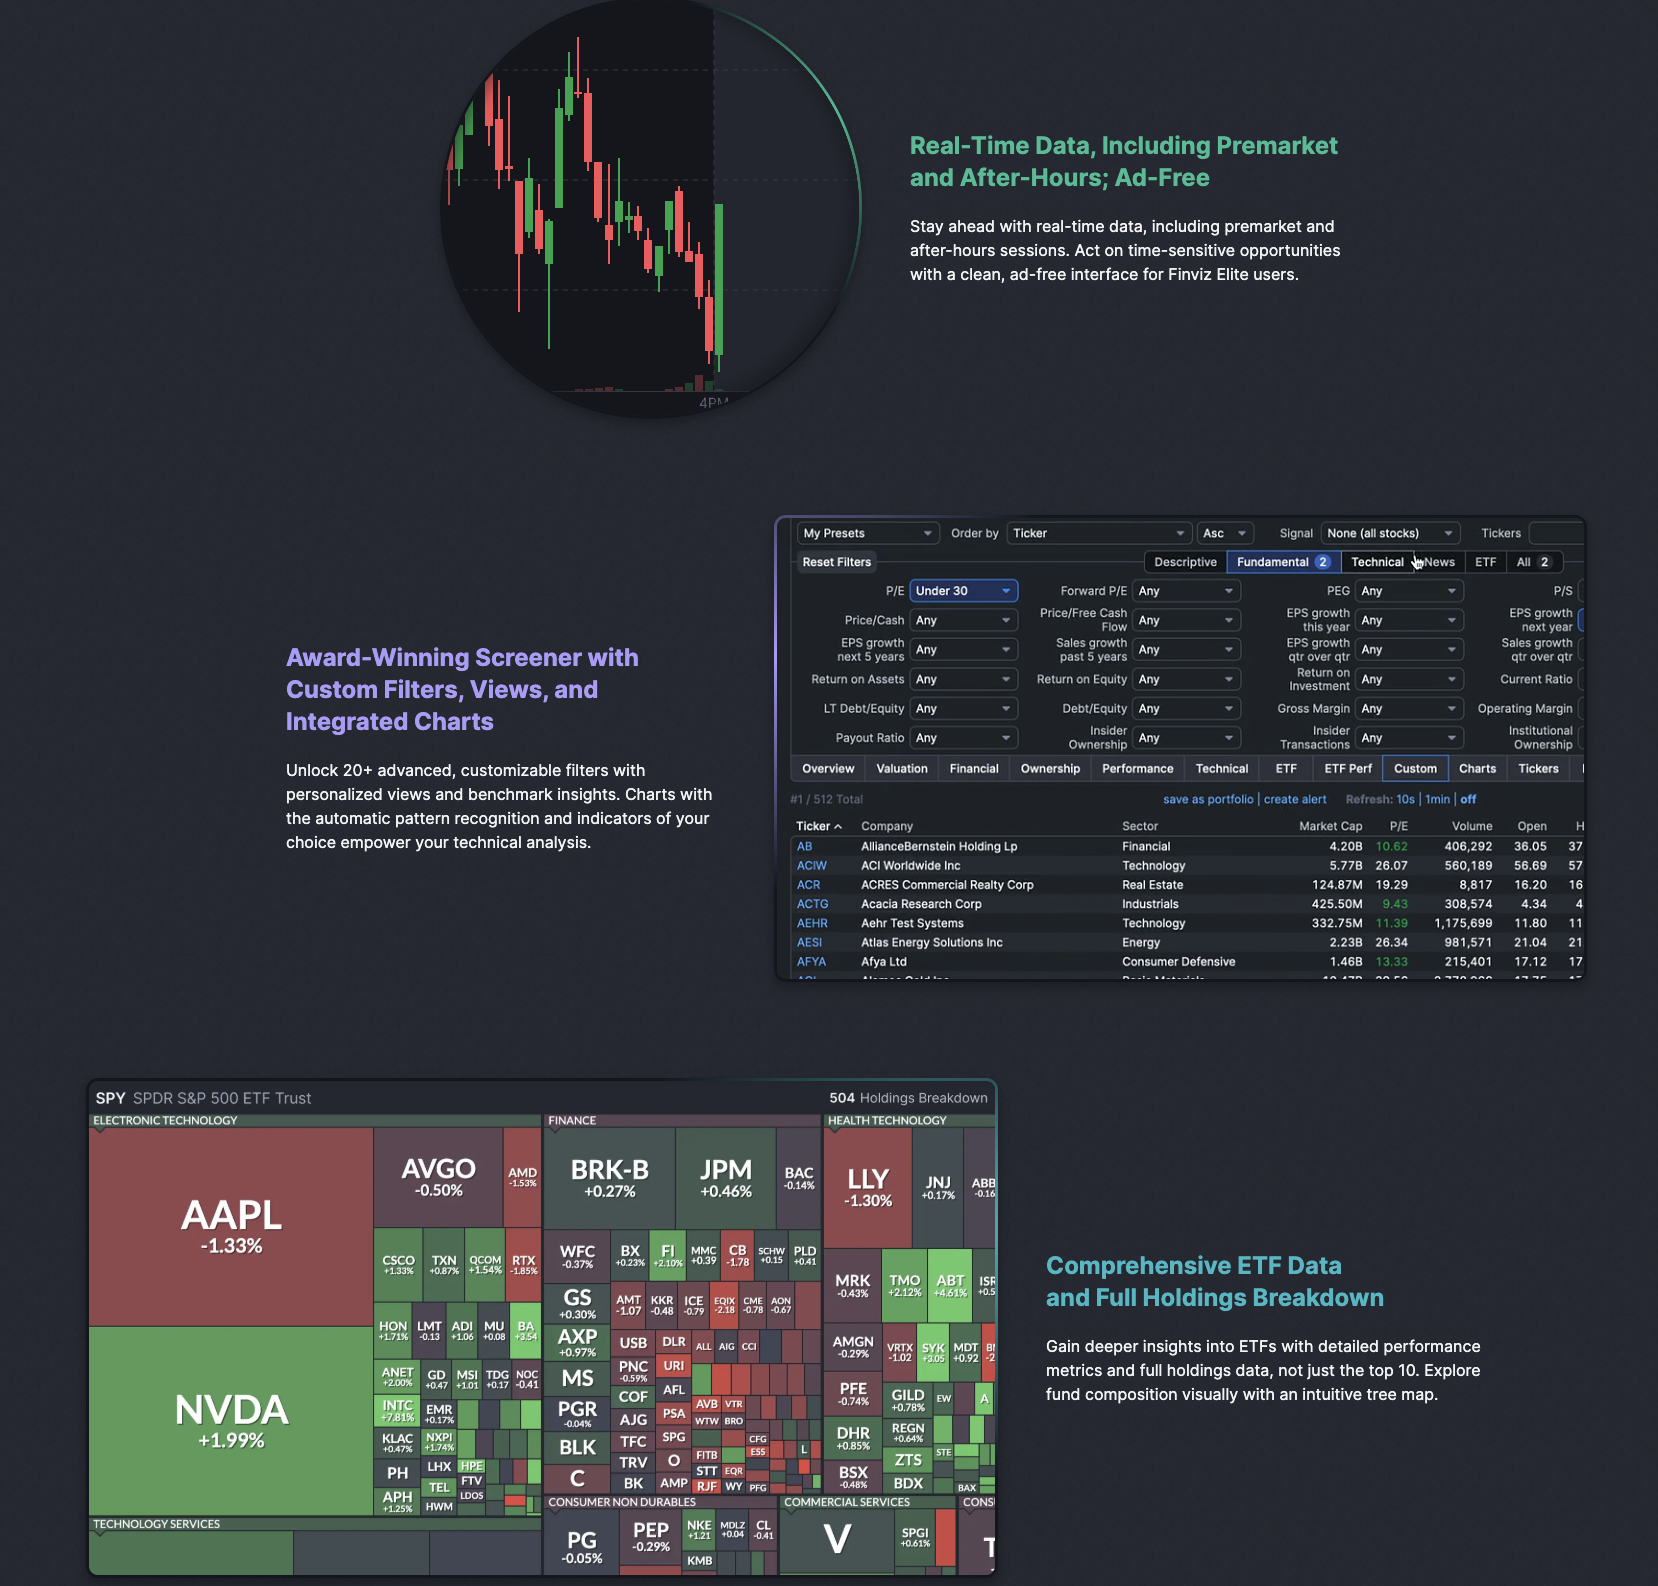
The platform offers heat maps, news aggregation, basic charting, and data visualization, prioritizing function over form for quick access to market data and quantitative trading opportunities.
How it empowers Quantitative Analysis
Finviz serves as a gateway to quantitative market data through comprehensive screening and analysis capabilities:
- Advanced Screener: Apply dozens of quantitative filters simultaneously (P/E ratios, EPS growth, technical indicators, etc.)
- Data Visualization: Heat maps and performance charts provide immediate quantitative summaries across markets and sectors
- Backtesting Engine (Elite): Test quantitative trading strategies against up to 24 years of historical data
- Correlation Analysis (Elite): Analyze statistical relationships between stocks and assets using quantitative finance methods
- Real-Time Data & Export (Elite): Essential for quantitative trading execution and offline analysis
What you get with membership
Elite subscription adds crucial features for serious quantitative analysis:
- Real-time and extended hours data
- Advanced charting with intraday timeframes
- Backtesting capabilities for strategy validation
- Correlation analysis tools
- Email alerts and data export functions
Finviz’s free screener is indispensable for generating quantitative ideas; Elite adds real-time data and advanced features for executing serious quantitative trading strategies.
5. Stock Market Guides
- Overall Rating: 4.5
- Cost: Around $69/month for option picking service and $49/month for swing trading picks. DIY Scanners have Free and Paid tiers
- Best for: Swing and options traders seeking statistically backtested alerts and scanning tools
What it is
Stock Market Guides takes a unique approach centered on historical performance and statistical edge, making it a standout among quantitative analysis tools.
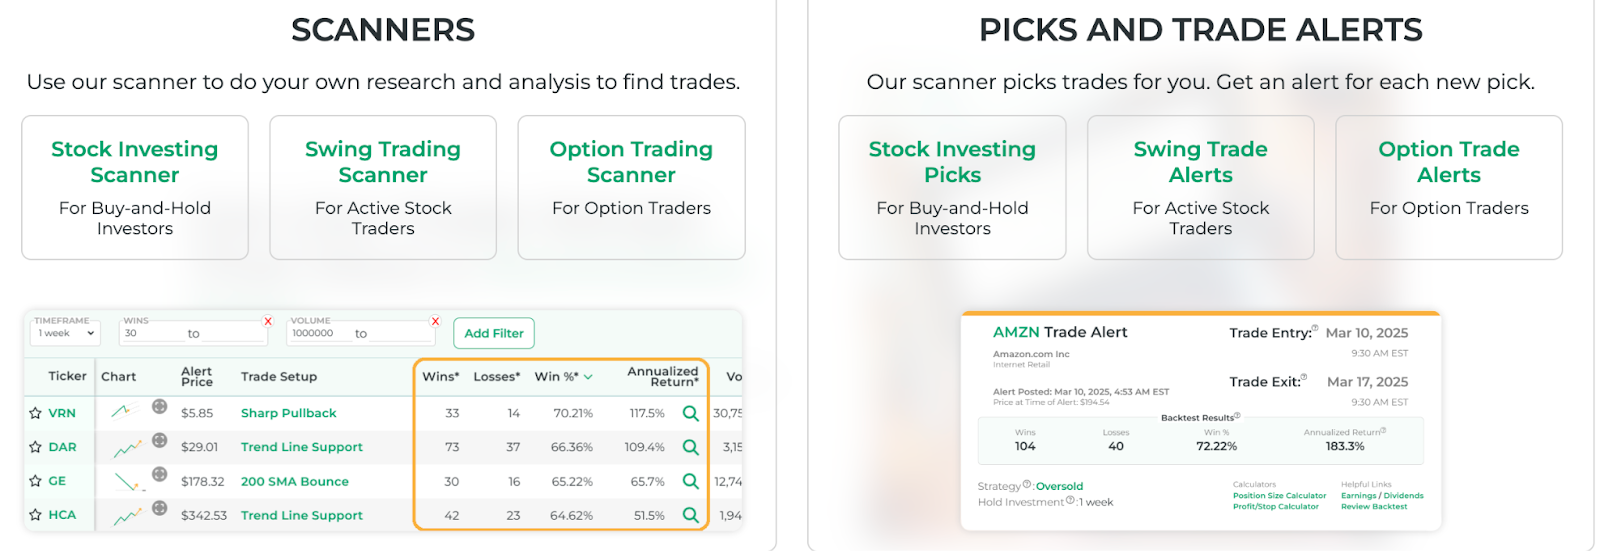
The platform offers two paths: DIY Scanners for filtering through system-flagged setups, and Stock/Option Picks, which deliver specific trade alerts (up to 3 daily) based on high-conviction strategies derived from extensive quantitative analysis.
How it empowers Quantitative Analysis
The entire platform revolves around applied quantitative principles and represents what is quantitative trading in its purest form:
- Backtested Strategies: All alerts stem from strategies validated against extensive historical data using rigorous quantitative analysis
- Algorithmic Scanning: Uses algorithms derived from successful backtests to identify profitable setups
- Explicit Performance Metrics: Provides historical backtested performance data for each pattern
- Quantitative Filtering: Filter results based on historical performance metrics and statistical significance
- Statistical Edge Focus: Emphasizes probabilistic thinking and positive expectancy, fundamental to quantitative finance
What you get with membership
Different subscription levels offer varying access to these powerful quantitative analysis tools:
- DIY Scanners (Paid): Real-time scanners with historical performance data and filtering capabilities
- Stock/Option Picks: Specific trade alerts with entry, stop, and target suggestions based on quantitative models
- Free Version: Limited scanner access without performance data
For traders seeking signals explicitly backed by quantitative analysis and backtesting data, Stock Market Guides provides a focused, statistically driven approach to systematic trading.
6. Seeking Alpha Premium
- Overall Rating: 4.6/5
- Cost: $299/year (Introductory offers common)
- Best for: Active fundamental investors valuing data-driven insights, quantitative ratings, and expert analysis
What it is
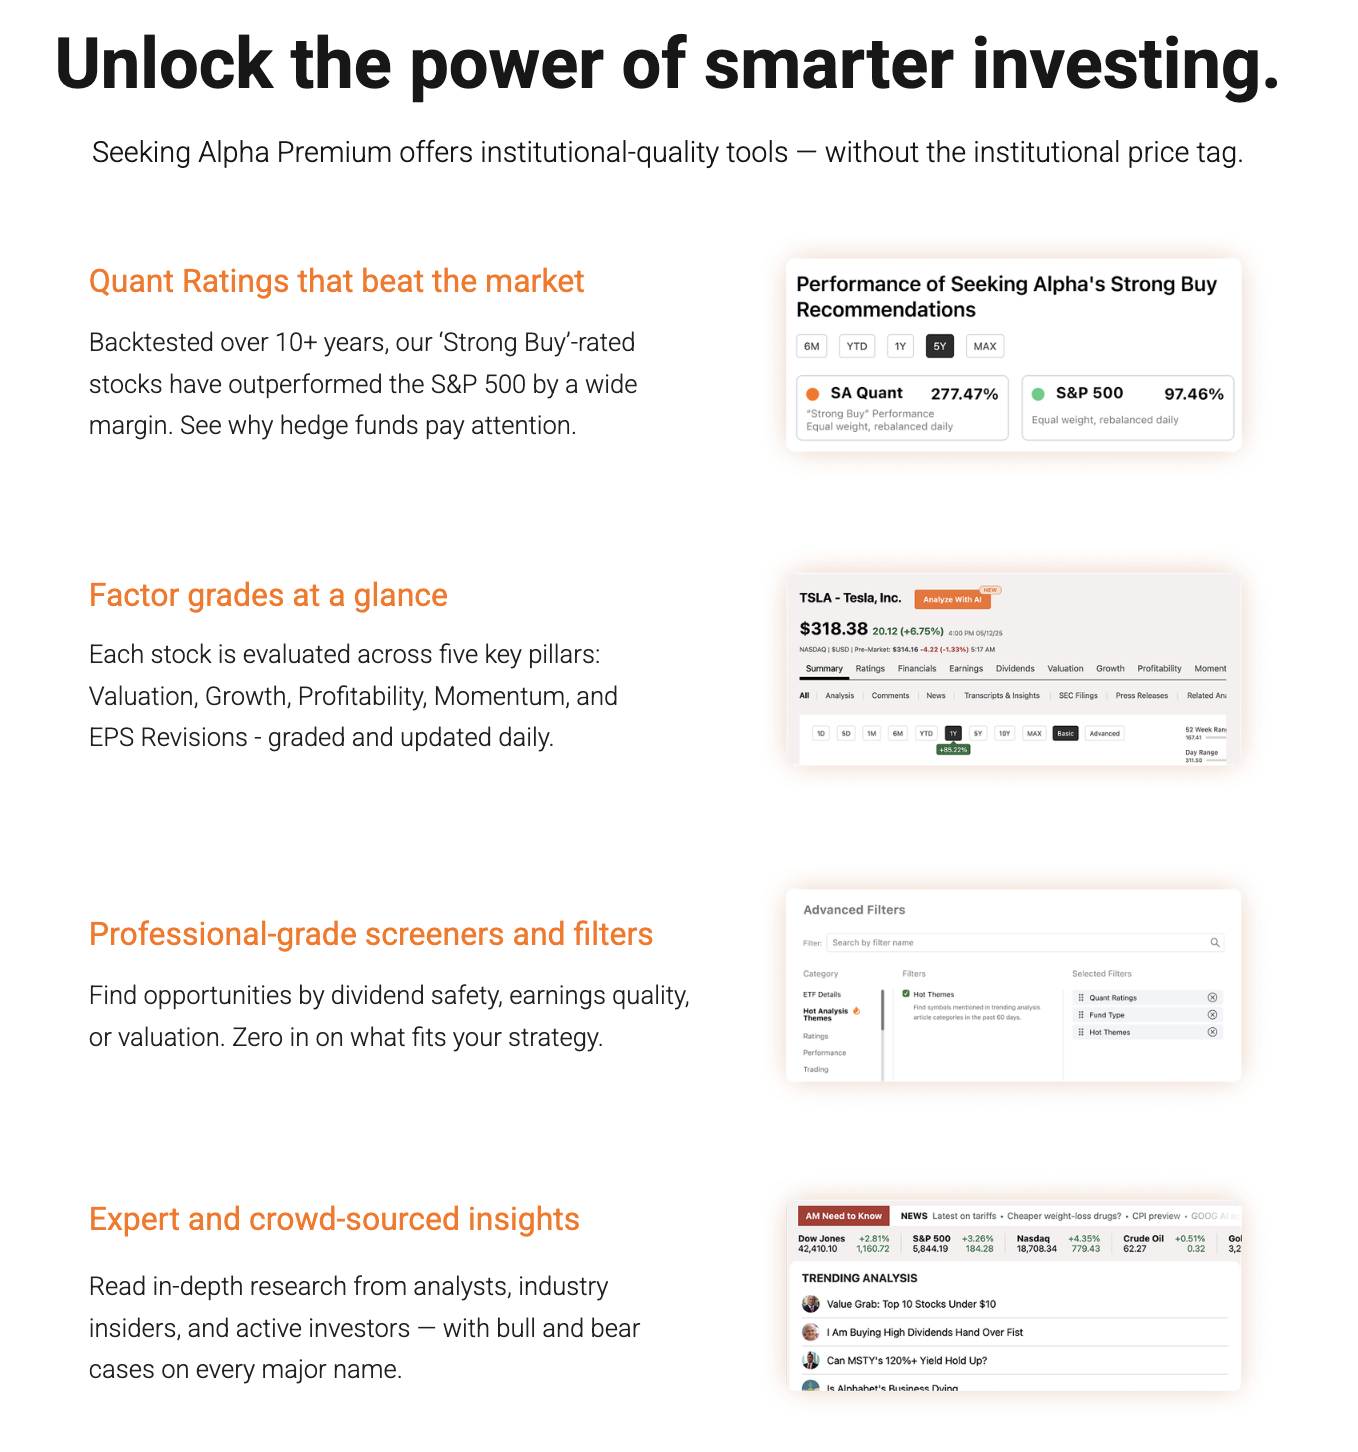
Seeking Alpha Premium combines crowd-sourced investment research with proprietary data tools and quantitative analysis. The platform encompasses a vast universe of assets and provides powerful screening and rating capabilities.
How it empowers Quantitative Analysis
The platform offers quantitative tools as core features, making it valuable among comprehensive quantitative analysis tools:
- Quant Ratings: Proprietary model rating stocks from Strong Sell to Strong Buy based on sector comparisons across five factors using advanced quantitative analysis
- Factor Grades: Individual letter grades (A+ to F) for Value, Growth, Profitability, Momentum, and EPS Revisions
- Advanced Screener: Filter by Quant Ratings, Factor Grades, and numerous financial metrics
- Extensive Financial Data: 10 years of detailed, downloadable financial statements for building quantitative models
- Dividend Grades: Quantitative assessment of dividend safety, growth, and consistency using statistical methods rooted in quantitative finance
What you get with membership
Premium unlocks essential features for serious quantitative analysis:
- Full Quant Ratings and Factor Grades access
- Advanced screening capabilities with multiple quantitative filters
- Comprehensive financial data archive for backtesting and model building
- Stock comparison tools for relative quantitative analysis
- Unlimited premium content access
Seeking Alpha Premium excels at integrating quantitative analysis tools with qualitative research. It is ideal for investors who want both data-driven signals and analytical context for their quantitative trading strategies.
Want even more quant magic?
The PRO Quant Portfolio
Available exclusively in Seeking Alpha PRO
The PRO Quant Portfolio is an actively rebalanced model portfolio powered by the same index-beating Quant system behind Seeking Alpha’s strongest-rated stocks.
It’s a complete strategy that removes emotion from the equation—allocating capital based on data-driven signals, not market noise. Every position is selected using five core factors: valuation, growth, profitability, momentum, and earnings estimate revisions.
7. Mindful Trader
- Overall Rating: 4.0/5
- Cost: $47/month
- Best for: Swing traders seeking specific alerts based on statistically backtested approaches
What it is
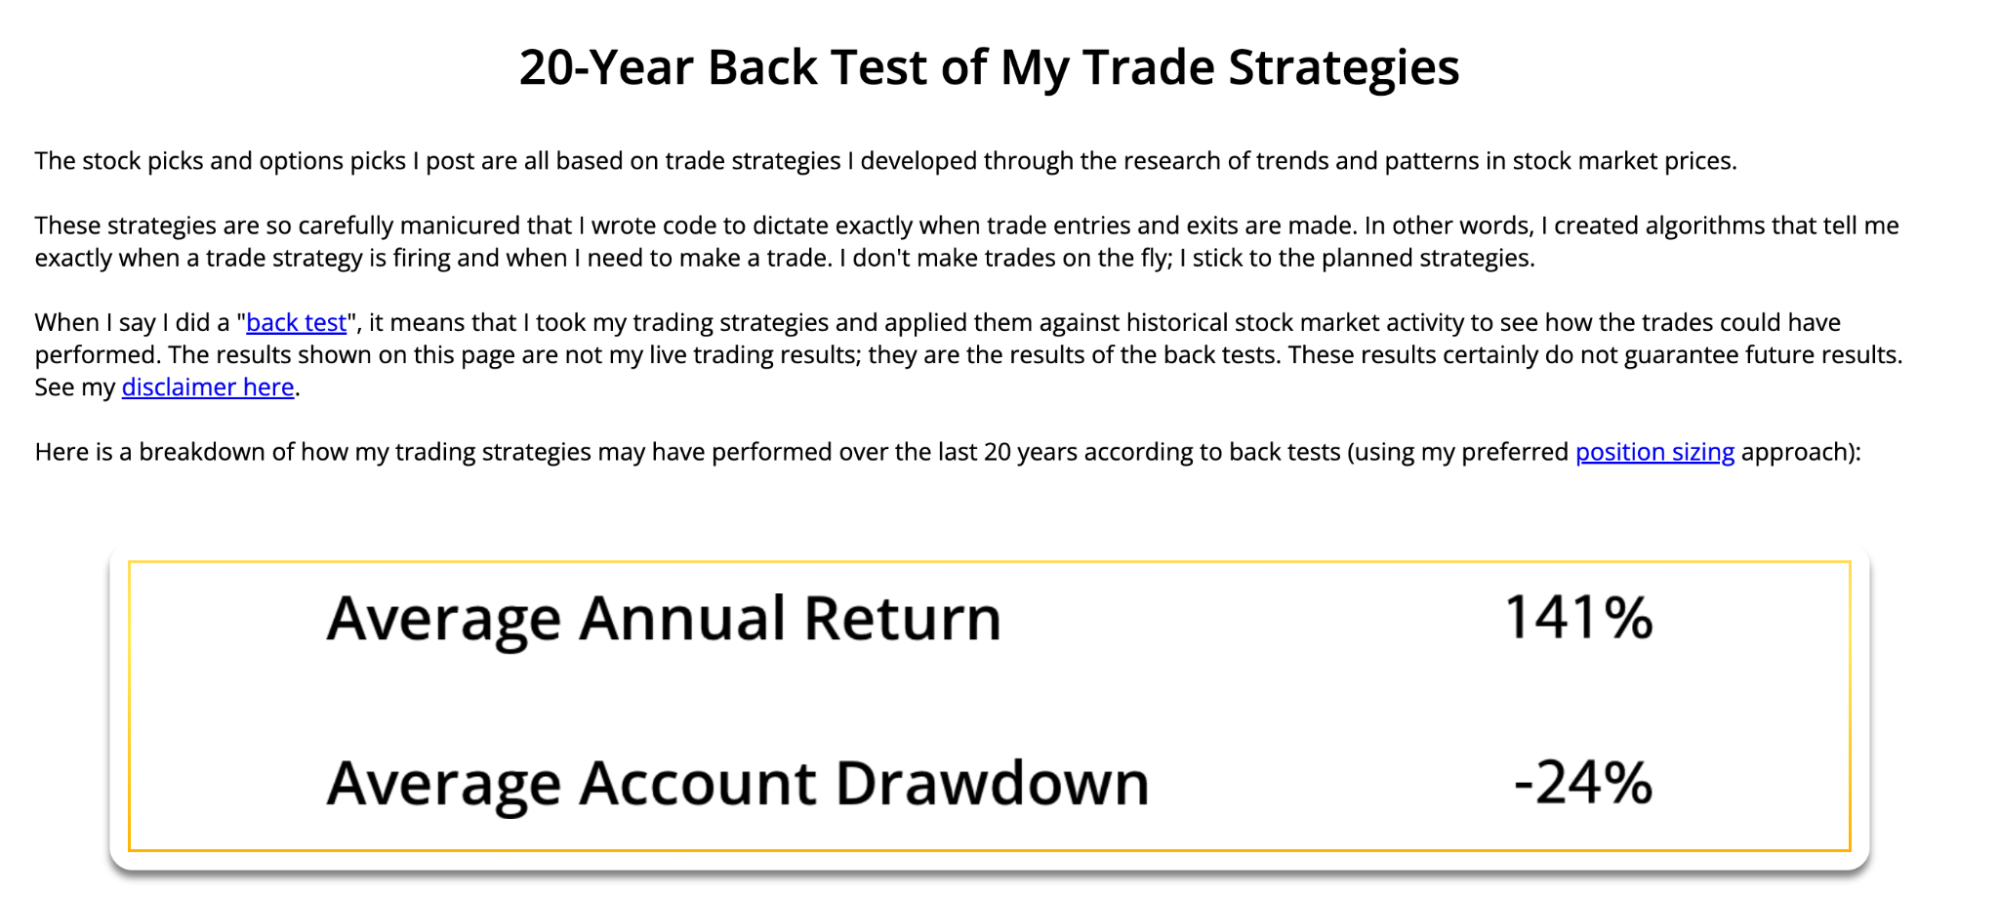
Mindful Trader focuses on delivering specific trade alerts derived from strategies that have been rigorously backtested over 20 years of market data.
The service targets swing trades, which are typically held for about a week, providing subscribers with exact entry and exit signals, along with educational content that demonstrates the practical applications of quantitative trading principles.
How it Empowers Quantitative Analysis
The service revolves around applied quantitative principles, serving as an excellent example of AI quantitative trading in action:
- Backtested Statistical Edge: Alerts generated from strategies with demonstrated positive expectancy through comprehensive quantitative analysis
- Data-Driven Signals: Quantitative models identify setups matching historical criteria
- Probabilistic Approach: Emphasizes statistical edge and drawdown management core to quantitative finance
- Strategy Education: Teaching quantitative logic behind trades and quantitative trading strategies
- Performance Tracking: Historical results for quantitative evaluation of system performance
What you get with membership
Access to practical applications of quantitative analysis tools:
- Real-time stock and options alerts with specific entry/exit levels
- Access to the founder’s live positions for transparency
- Daily watchlist of potential setups based on quantitative models
- Educational materials on developing and implementing quantitative trading strategies
- Risk management guidance rooted in quantitative finance principles
Mindful Trader offers a direct application of quantitative analysis through specific, backtested trade alerts for systematic swing trading, perfect for those who want to see quantitative trading in action.
What is Quantitative Trading?
Now that we’ve explored various quantitative analysis tools, let’s address the fundamental question: What is quantitative trading? At its core, quantitative trading represents a systematic approach to investing that relies on mathematical models and statistical analysis rather than intuition or subjective interpretation.
Understanding quantitative trading is essential for anyone serious about implementing these powerful quantitative analysis tools effectively.
Quantitative trading utilizes data and algorithms to accelerate investment decisions, fostering a disciplined and emotion-free trading environment.
Unlike traditional approaches that might rely on gut feelings or fundamental technical analysis, quantitative finance employs rigorous mathematical frameworks to identify and exploit market opportunities.
The quantitative trading process typically involves:
- Strategy Development: Identifying market patterns or inefficiencies that can be expressed mathematically using quantitative analysis
- Backtesting: Testing mathematical models against historical data to validate profitability potential
- Execution: Implementing validated quantitative trading strategies through automated or semi-automated systems
- Risk Management: Defining strict rules for position sizing and portfolio risk based on quantitative measures
Modern AI quantitative trading incorporates machine learning and artificial intelligence to uncover complex patterns and adapt strategies more quickly than traditional quantitative finance methods. Some quant ratings systems even combine AI with “traditional” fundamental checks — like the Zen Ratings system.
This evolution allows individual traders to access sophisticated analytical capabilities previously reserved for institutional investors, democratizing access to advanced quantitative analysis tools.
The advantage of quantitative trading lies in its objectivity. By removing emotional decision-making and relying on proven statistical relationships, traders can achieve consistent results.
Whether you’re using simple moving average crossovers or complex multi-factor models, the key is maintaining discipline and trusting the quantitative analysis that underpins your strategy.
Final Word: Best Quantitative Analysis Trading Tools in 2025
The seven platforms we’ve explored offer different entry points into the world of data-driven trading, from the accessible ratings of Zen Ratings to the sophisticated backtesting capabilities of TrendSpider.
You may be a fundamental investor seeking to incorporate quantitative validation into your process or an active trader developing systematic approaches.But the key is to find quantitative analysis tools that align with your goals, budget, and technical expertise.
Understanding what quantitative trading is and how it differs from traditional approaches is essential for selecting the right platform to meet your needs.
The power of quantitative trading lies in its objectivity and discipline. By leveraging these quantitative analysis tools, you can make more informed, evidence-based decisions while mitigating emotional biases that plague many investors.
The integration of AI quantitative trading capabilities across these platforms makes sophisticated analysis more accessible than ever before.
Remember that no quantitative analysis tools guarantee profits, and historical backtesting doesn’t ensure future success.
However, incorporating robust quantitative finance principles into your investment process provides an advantage in today’s competitive markets. The quantitative trading strategies you develop using these tools should be continuously monitored and refined as market conditions evolve.
Start with the platform that best matches your current needs and gradually expand your toolkit of quantitative analysis tools as your experience and confidence grow.
The future belongs to data-driven investors who can successfully combine quantitative analysis with sound risk management principles.
FAQs:
What are some examples of quantitative trading strategies?
Common quantitative trading strategies include statistical arbitrage (exploiting price discrepancies between related assets using quantitative analysis), mean reversion (betting prices return to historical averages), trend following (capitalizing on established market trends), factor investing (building portfolios based on quantitative factors like value and momentum), and event-driven trading (trading based on predictable market reactions to specific events like earnings announcements).
These strategies all rely on rigorous quantitative analysis and backtesting.
What is the difference between algorithmic and quantitative trading?
While often used interchangeably, quantitative trading refers to strategy development that utilizes mathematical models and quantitative analysis, whereas algorithmic trading refers to the execution method that employs computer programs.
Most quantitative trading relies on algorithmic execution, but not all algorithmic trading necessarily involves complex quantitative models.
Some algorithms simply execute large orders gradually, without sophisticated quantitative analysis or mathematical strategies underlying the decisions.
What is an example of a quantitative trade?
A simple mean reversion example using quantitative analysis: Calculate a stock's 20-day moving average and standard deviation, then create bands at MA ± 2SD.
Buy when price closes below the lower band, sell when it closes above the upper band, and exit when price crosses back through the moving average.
This rule would be backtested using historical data and quantitative analysis tools to assess its profitability and risk before implementation, demonstrating practical quantitative trading in action.
Can you make money with quantitative trading?
Yes, many hedge funds and trading firms are built entirely on quantitative trading strategies and principles of quantitative finance.
However, success requires significant expertise, robust infrastructure, rigorous quantitative analysis, and constant adaptation as markets evolve.
Individual traders can profit by identifying specific niches, maintaining realistic expectations, managing risk meticulously, and utilizing appropriate quantitative analysis tools effectively, while understanding what quantitative trading fundamentally entails.
How to use quantitative analysis in trading?
You can incorporate quantitative analysis through multiple approaches: stock screening (using quantitative analysis tools like Finviz to filter based on specific criteria), strategy validation (backtesting ideas with platforms like TrendSpider), risk management (using volatility and correlation measures from quantitative finance), signal generation (following alerts from services that employ quantitative trading strategies), and factor investing (building portfolios tilted toward factors identified through quantitative analysis, often using factor-based scores like those from Seeking Alpha or Zen Ratings).
The key is selecting quantitative analysis tools that match your trading style and systematically applying quantitative trading principles.
Where to Invest $1,000 Right Now?
Did you know that stocks rated as "Buy" by the Top Analysts in WallStreetZen's database beat the S&P500 by 98.4% last year?
Our September report reveals the 3 "Strong Buy" stocks that market-beating analysts predict will outperform over the next year.