

2 AI Stocks That Beat the Earnings Algorithms
Not long ago, Microsoft had its best day since 2008. It gained over 15% in a single session and added more than $450 billion in market value. That's more than the market cap of most companies in the S&P 500, gained in one day.
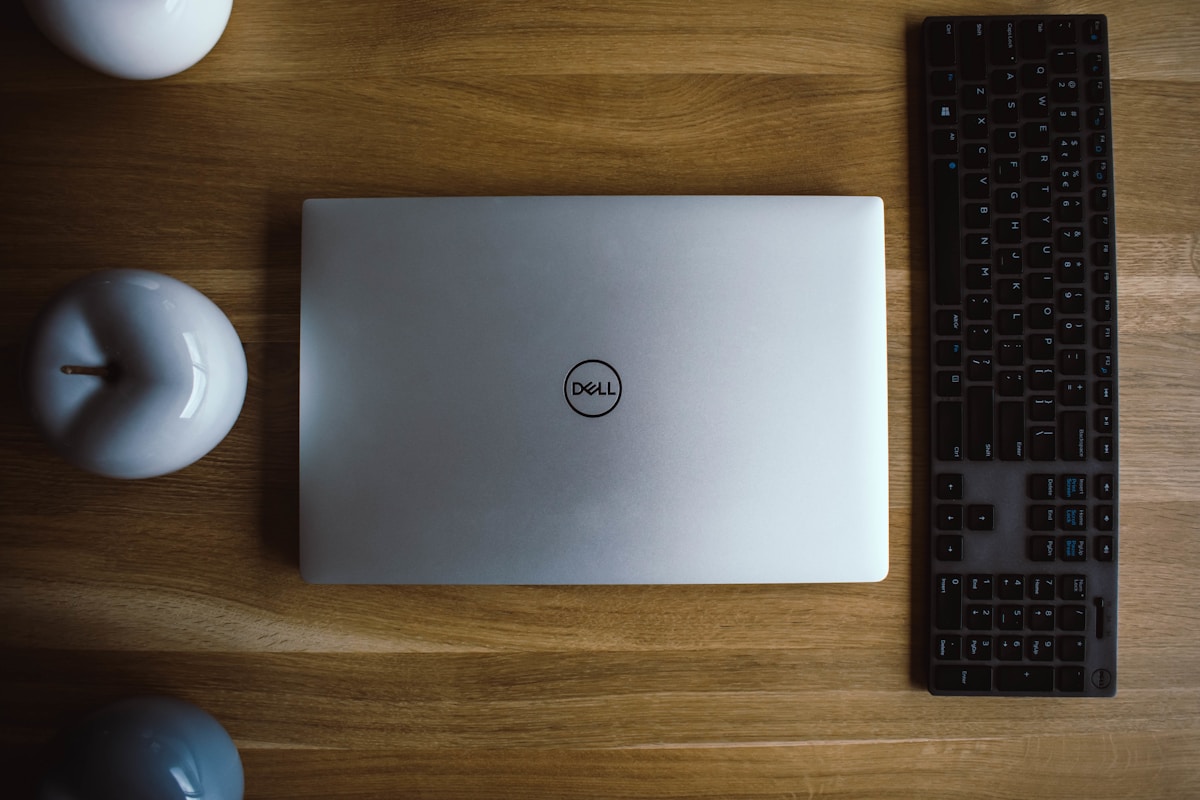
A few weeks later, Dell reported earnings. Within minutes, the stock was up more than 10% in after-hours trading. By the next afternoon's close, it had gained almost 16%.
A note from our sponsors...
With a valuation of $85.7 billion, the SpaceX IPO is officially the largest IPO of all time. The company captured the public's imagination while simultaneously dominating critical industries, and it set records when it went public. But SpaceX is just one of 7 high potential IPO candidates identified by our analysts as being positioned at the front of the next wave of IPOs. Get their names, free.These are some of the most closely followed companies globally, covered by dozens of Wall Street analysts. So how does a stock like that move 10% before most investors have even opened the press release?
The short answer is that the first reader of an earnings report today usually isn't a person.
Here's what's really happening in those first few minutes after earnings, why the moves have gotten so big, and how you can use them instead of getting caught in the crossfire. Along the way, 2 stocks that just made big post-earnings moves and still earn outstanding grades in our market-beating quant rating system. The second one also did something surprising: it put up a blowout quarter, but the stock fell anyway. The pullback could be short-lived, so it's worth knowing about now.
How Earnings Season Used to Work
Think about what earnings day looked like for a regular investor 30 years ago.
If a stock you owned reported its results after the market close, you found out the next morning, from the business section of the newspaper or a financial news show. You then checked the price on a delayed feed, picked up the phone, and called your broker to place a trade.
Analysts had access to quarterly numbers on the conference call and research notes landed the next morning. Notably, a stock could keep adjusting to the news for days.
Today, the whole story plays out before most people have even read the headline.
What Happens in the First 60 Seconds Now
When a company releases earnings, the numbers go out over a newswire at a set time. The first reader almost never has a pulse.
Estimates vary, but somewhere between 60% and 75% of all U.S. stock trading volume is now executed by automated systems, and a small number of high-frequency trading firms account for most of it. The software has already parsed the release, compared revenue, earnings per share, and guidance against what Wall Street expected, and started placing orders before a person could finish reading the headline.
Then a second layer kicks in. Once that first wave of buying or selling moves the price, trend-following algorithms pile on simply because the price is moving, not because they've formed any opinion about the business. One surprise can snowball into a much bigger move within minutes, in either direction.
When Target reported in August, earnings per share came in at $4.11. Analysts were expecting $2.33. On the surface, that's a 76% beat. But $1.65 of the beat was tied to one-time tariff refunds Target had already paid. Strip that out, and the beat was much smaller.
So the stock slipped in premarket trading. Then investors noted a few key details. Store traffic was up 3.6%, and full-year guidance was raised. By early trading, the stock had flipped to a 5% gain.
Meta did the opposite. Reported earnings per share missed estimates by about 14%. But most of that miss originated from one-time legal and severance charges. Adjusted for the one-time charges, Meta met expectations, but the stock slipped 7.5% after hours. The algos focused on narrowing profit margins as free cash flow declined 90% year over year, driven by AI data center spending.
So the machines aren't just reacting to one number. They're weighing the whole picture, in seconds. That brings us to the first stock.
Dell (DELL)
The first stock is Dell (DELL), a textbook example of everything we just talked about.
Dell is among the hottest AI stocks in 2026, given it builds the servers that run inside AI data centers.
The server maker reported revenue of $47 billion in the last quarter, up 60% year over year. AI server sales doubled to $16 billion, while earnings stood at $7 per share, above estimates of $5 per share. Over the last 12 months, Dell earnings have risen by 150%. Dell ended Q2 with $95 billion in AI orders, a massive backlog that provides revenue visibility.
Now, the stock has roughly quadrupled over the past year, so it's fair to ask whether you've missed the bus. Here's why the case says otherwise.
Management just raised its full-year earnings forecast from about $18 per share to more than $25 per share. Wall Street estimates earnings to grow by 50% over the next year, while sales are projected to increase 30%. A widening earnings base should drive share prices higher, if Dell continues to beat consensus estimates and guidance over the next 12 months.
Of the 22 analysts we track who cover Dell, 17 have a Buy or Strong Buy recommendation, and none recommend selling. Several of the analysts in this group are elite in terms of their stock-picking track record. Asiya Merchant at Citigroup, who ranks in the top 1% of analysts we track, has a Strong Buy recommendation, with an average return on stock picks of over 175%. And Ben Reitzes at Melius Research, a top 8% analyst, also has a Strong Buy recommendation, with a price target that suggests the stock could see more than 30% upside in the coming year.
Our Zen Ratings system backs that up. Zen Ratings grades every stock using 115 fundamental, technical, and AI factors, then distills it into an intuitive letter grade, A through F. A-rated stocks have historically trounced the S&P by nearly 3 to 1.
Dell earns an overall A rating, which amounts to a Strong Buy recommendation, and it ranks in the top 4% of all stocks we track based on its stellar fundamentals.
Looking at the 7 underlying Component Grades: it ranks in the top 23% for Financials, a sign of a healthy, profitable business. It's in the top 7% for Growth, which reflects how quickly its earnings and revenue are expanding. It's in the top 5% for Sentiment, a sign that Wall Street analysts and big institutional investors are firmly on board. And it ranks in the top 1% for Momentum, which means very few stocks have a stronger price trend right now.
However, Dell ranks in the bottom 25% for Safety. After a spectacular run, the stock could move lower if guidance disappoints Wall Street. Armed with a robust order book and strong demand, Dell continues to raise its outlook, making it a name worth watching, backed by an attractive Zen Rating.
Now, a bit more about why humans are still actually in charge, before we get to the second stock.
The Humans Are Still in Charge
While it may seem like the robots are taking over the financial markets, the software is still built on the basis of human inputs.
Somebody still decides that guidance matters more than historical numbers. The analyst decides that a one-time tariff refund shouldn't count, or that free cash flow is a key number amid rising AI spending. These are judgment calls, and they're made by people weeks before the report comes out.
The machines could entice a knee-jerk short-term reaction. But the earnings data is then digested by long-term investors who might have an entirely different investment thesis.
Why the Moves Are So Big
There's another reason these post-earnings moves look so dramatic, and it's one most investors miss.
Most big companies report after the market closes. So the initial move occurs in after-hours trading, when trading volume is light. Include a wave of algorithmic orders and it can result in volatile price movements, before the market opens officially.
Microsoft is a good example of how the first reaction doesn't always tell the full story. After its report in late July, the stock was up only about 3% after hours. Then in the regular session, institutional buying drove the stock higher by 15.5%.
You can also see what the market expects ahead of time. Before every earnings report, the options market prices in an expected move. Going into that week, options were pricing in a move of roughly 6% for Microsoft and roughly 6% for Amazon. Microsoft moved 15.5%, while Amazon jumped more than 10%. When the actual move is 2 or 3 times what was priced in, it indicates the results genuinely surprised investors.
And that brings us back to the second stock on the list.
If you want to stay one step ahead of the market, join our Live training every Monday, where we share an updated market outlook and trading plan to outperform, plus a Trade of the Week based on our proven Zen Ratings quant model. It's a free event, but you do need to register at wallstreetzen.com/live.
Hewlett Packard Enterprise (HPE)
Hewlett Packard Enterprise (HPE) is a perfect example of how misleading that first after-hours reaction can be.
HPE sells servers, storage and networking equipment, which is the plumbing that connects AI data centers together. Right now, the networking piece is part of the AI megatrend.
HPE's fiscal third quarter is one of the cleanest examples you'll find of algorithms and humans disagreeing with each other, twice, in the same week.
Act one: HPE reported revenue of $12.2 billion, up 34%, with both GAAP and adjusted earnings per share beating the top end of management's own guidance range. Networking revenue, the fastest-growing and highest-margin part of the business, was up 74.9%, with data center networking up 112% and the routing business up 270%. Then, within minutes of the release, algorithms zeroed in on a single forward-looking sentence about margins moderating next quarter, and the stock reversed to close down more than 4% after hours.
Act two: by the next day's close, the stock had gapped up and rallied to a 9.6% gain. That reversal wasn't algorithmic. It took human analysts and portfolio managers a full trading session to work through the details, decide that a networking business growing 75%, with its highest-margin lines growing well over 100%, mattered more than one line about near-term margin mix, and buy accordingly.
Act three: three days later, a top Wall Street firm downgraded HPE from Outperform to In Line, and the stock fell 7% before the market opened. That downgrade had nothing to do with the quarter that had just been reported. It was about valuation: after a 158.5% year-to-date rally, HPE now traded at 13 times its fiscal 2027 earnings estimate, against a five-year average of 8 times, and the analyst judged the stock fairly priced with fewer near-term catalysts left to justify paying up further.
Notice what happened across those three moves. The algorithms reacted to a single data point in seconds. Human investors reconsidered the full picture over the next full session. And a single analyst's judgment about a price-to-earnings multiple, a subjective call about how much is too much to pay, moved the stock more than either of the automated reactions.
Machines are excellent at reacting to a number that's already been defined as important. They're not the ones deciding what's important in the first place, or what a fair price actually is. That's still a human job, and it's one where a careful individual investor can compete on equal footing.
And the outlook for HPE suggests this trend has room to run. Analysts expect HPE's earnings per share to rise nearly 90% over the next year. Over the next 3 years, they expect earnings to grow about 29% per year, well ahead of the roughly 19% average for its industry.
Even after the run-up, the price still looks reasonable. HPE's PEG ratio is right around 1. The PEG ratio compares a stock's price-to-earnings ratio with how fast its earnings are expected to grow. A reading near 1 suggests you're not overpaying for that growth.
Wall Street analysts like what they see, too. Of the 17 analysts we track who cover HPE, 11 have a Buy or Strong Buy recommendation. Tim Long at Barclays, who ranks in the top 3% of analysts we track, has a Strong Buy recommendation, with a price target that suggests the stock could see roughly 25% upside in the coming year. Simon Leopold of Raymond James, who ranks in the top 1% of analysts we track, also has a Strong Buy recommendation, and as of this writing, their target is even better, calling for greater than 35% upside in the coming year.
Our Zen Ratings system is just as bullish. HPE earns an overall A rating, which amounts to a Strong Buy recommendation, and it ranks in the top 2% of all stocks we track.
Looking at its Component Grades: it ranks in the top 25% for Safety, a sign of a relatively stable business. It's in the top 18% for Value, which means the stock still trades at an attractive price relative to its fundamentals. It's in the top 14% for Momentum, reflecting a strong and steady price trend. It's in the top 10% for Sentiment, a sign that the smart money is firmly on board. And it ranks in the top 2% for Growth, which puts it among the fastest-growing companies we track.
One thing to watch is that analysts expect HPE's revenue growth to cool to about 9% per year after this surge. So the company will need to keep turning AI demand into higher profits.
What This Means for You
So how do you invest in a market where the first few minutes belong to a machine? Here's how to think about it.
Takeaway 1: Check the options-implied move before the report, not after. Before a company reports, the options market prices in an expected swing based on what traders are willing to pay to hedge against it. Heading into HPE's own report, that number was about 10.8%. If a stock is priced to move that much in either direction, it's worth asking honestly whether you'd be comfortable seeing that sizable an overnight position gap. If the answer is no, size the position down before the report. And remember HPE: even a significant revenue beat can send a stock down 4% in the first few minutes.
Takeaway 2: The first move is often just the opening argument, not the verdict. Dell's stock kept drifting higher for days after its September report, eventually gaining nearly 15% from where it stood before earnings. HPE went from down 4% to up 9.6% in about a day, then down 7% again three days after that. In both cases, the real story took days to fully play out. A sharp reaction, in either direction, deserves attention and your own research, not an assumption that the first print already had it right.
Takeaway 3: Watch guidance and valuation, not just the headline beat. HPE didn't fall after hours because of a bad quarter. It fell because of one sentence about margins next quarter. And it didn't get downgraded three days later because the business slowed down. It got downgraded because a forward P/E of 13 times, up from a historical average of 8, left an analyst thinking the upside potential could be limited. Before you buy or sell around an earnings report, look at what's happening to guidance and to the stock's valuation relative to its own history. It's also why analyst sentiment is one of the things our Zen Ratings system looks at.
What to Do Next?
Want to get in touch? Email us at news@wallstreetzen.com.
Keep Reading
See All News


Company
AboutNewsBlogStock Investing FAQPlansPrivacy PolicyTerms of ServiceCancellation & RefundsPerformanceHelp GuidesContactTwitterYouTubeNewsletterInformation is provided 'as-is' and solely for informational purposes and is not advice. WallStreetZen does not bear any responsibility for any losses or damage that may occur as a result of reliance on this data.